Working with the search result list
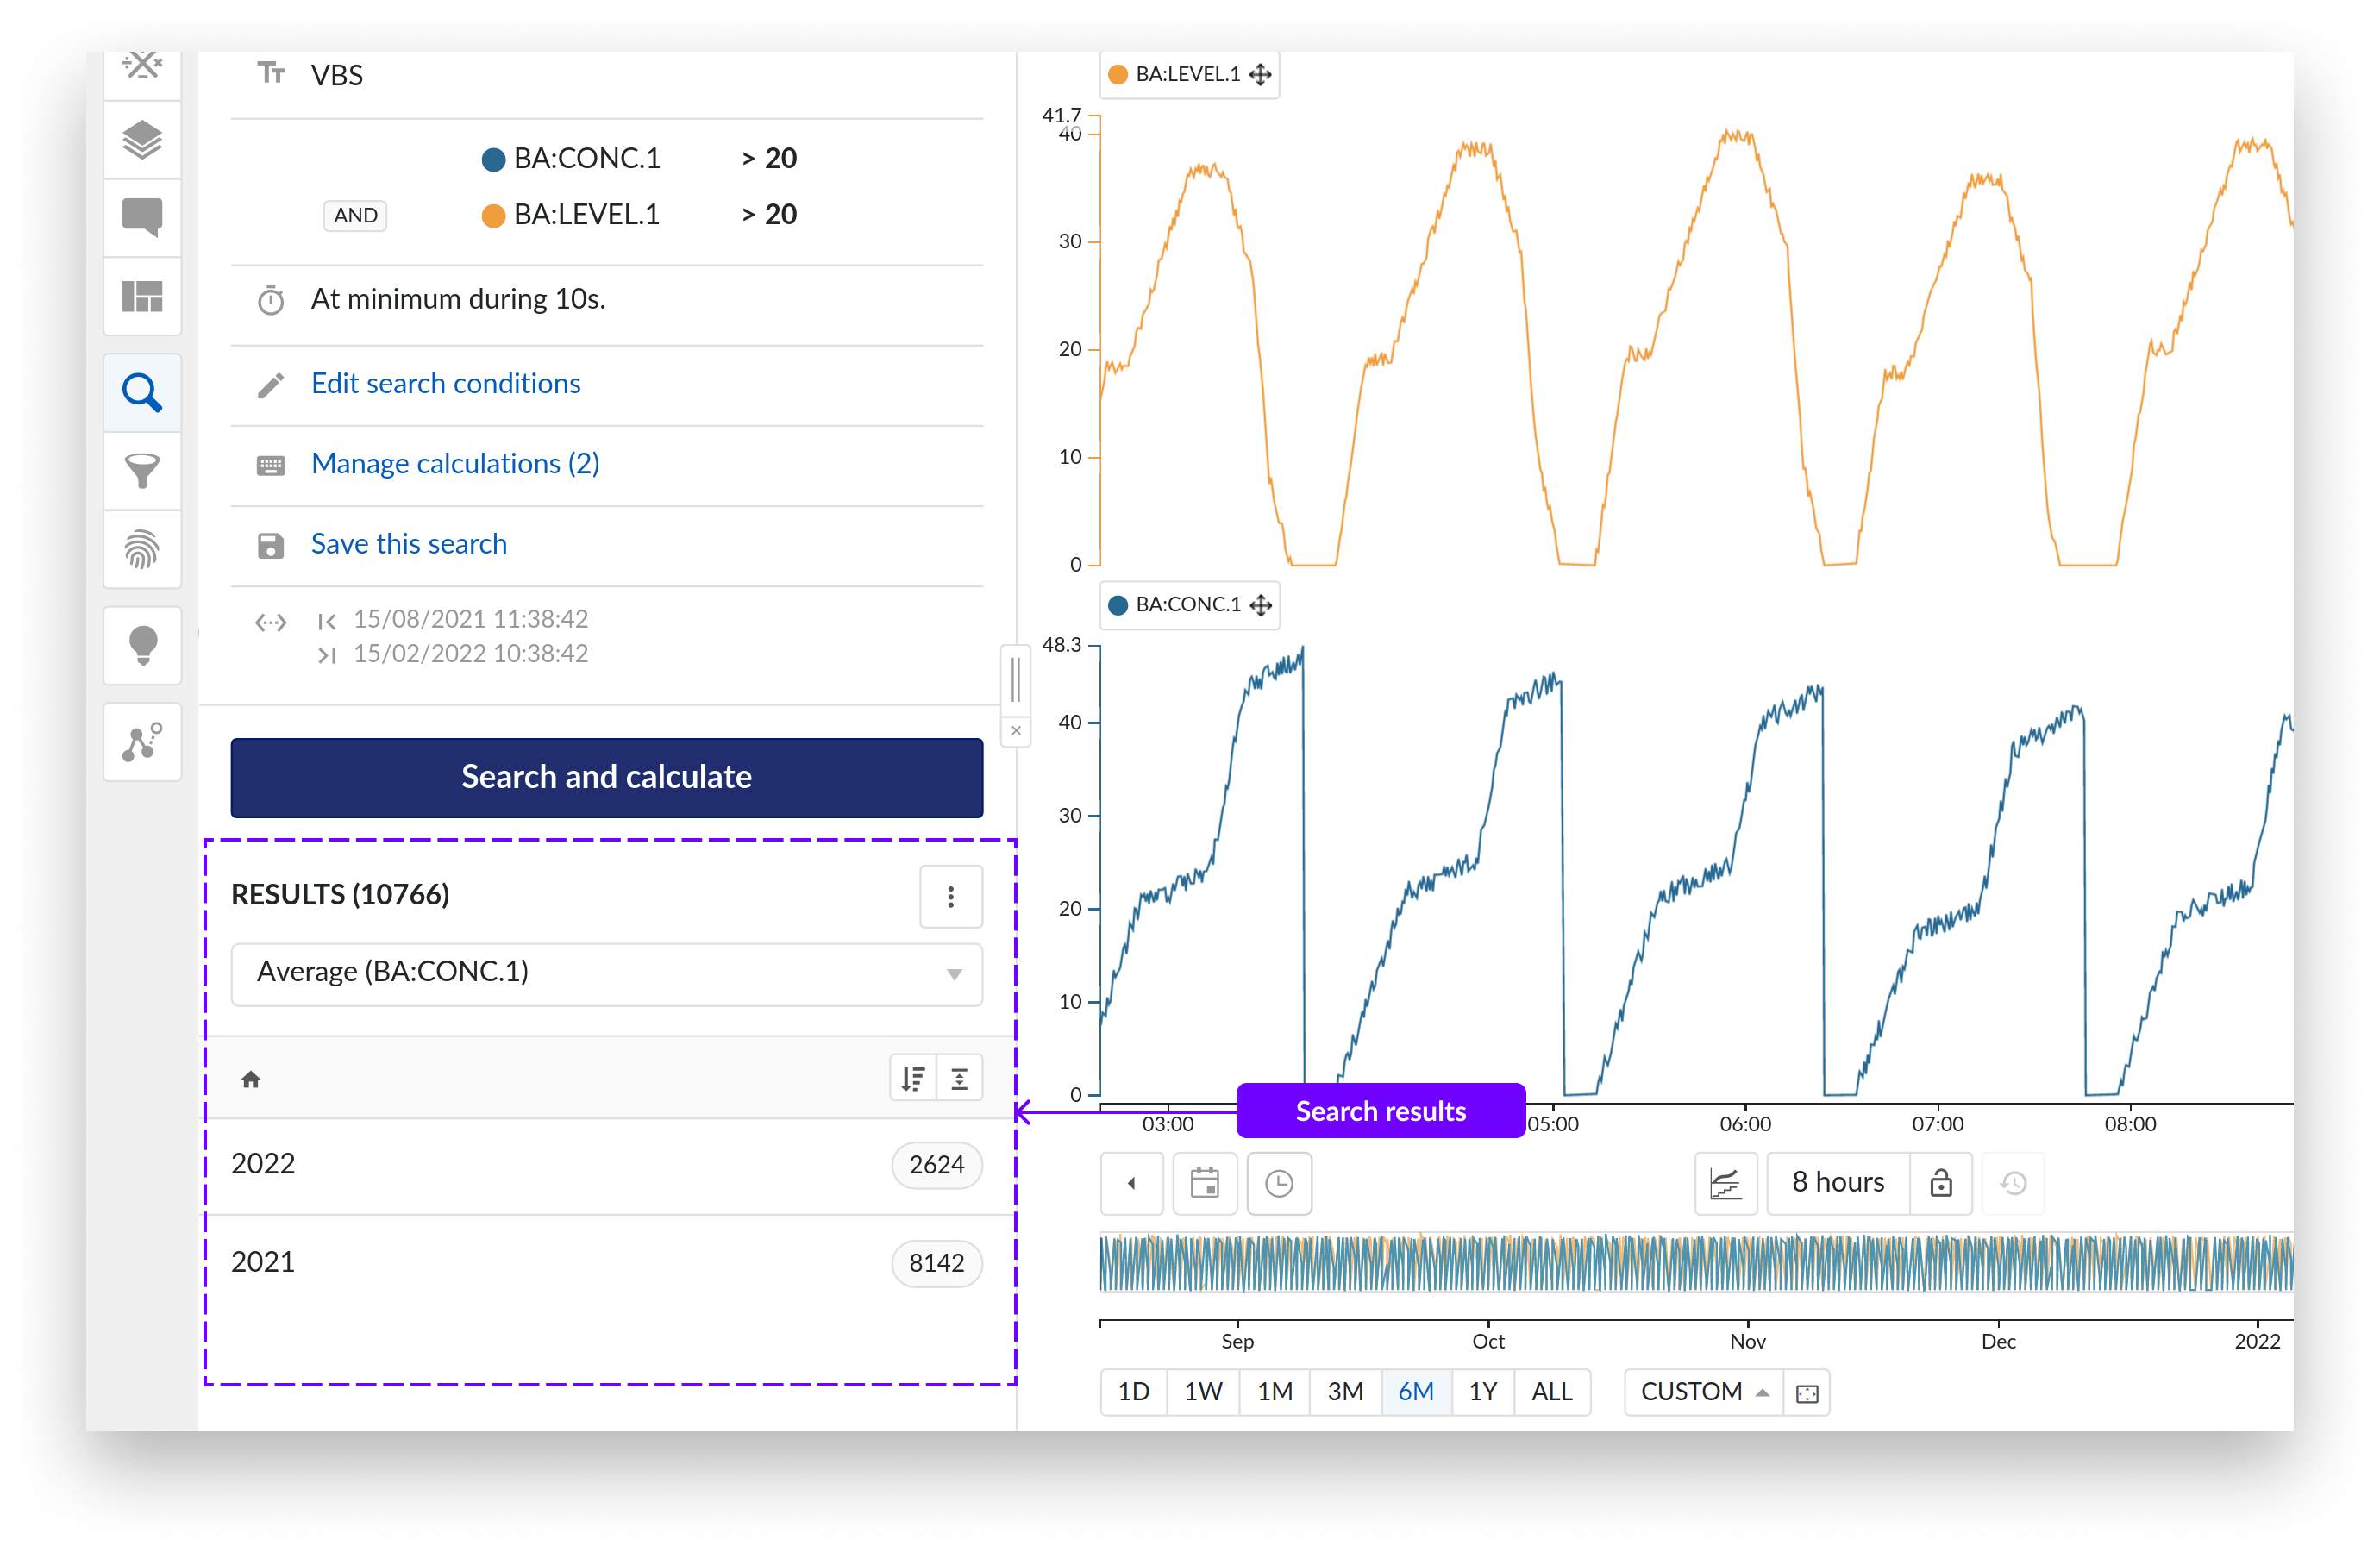
When you perform a search, the search results list will appear at the bottom left of your screen. The list contains the events that match your search criteria.
The current article describes how to work with the search result list.
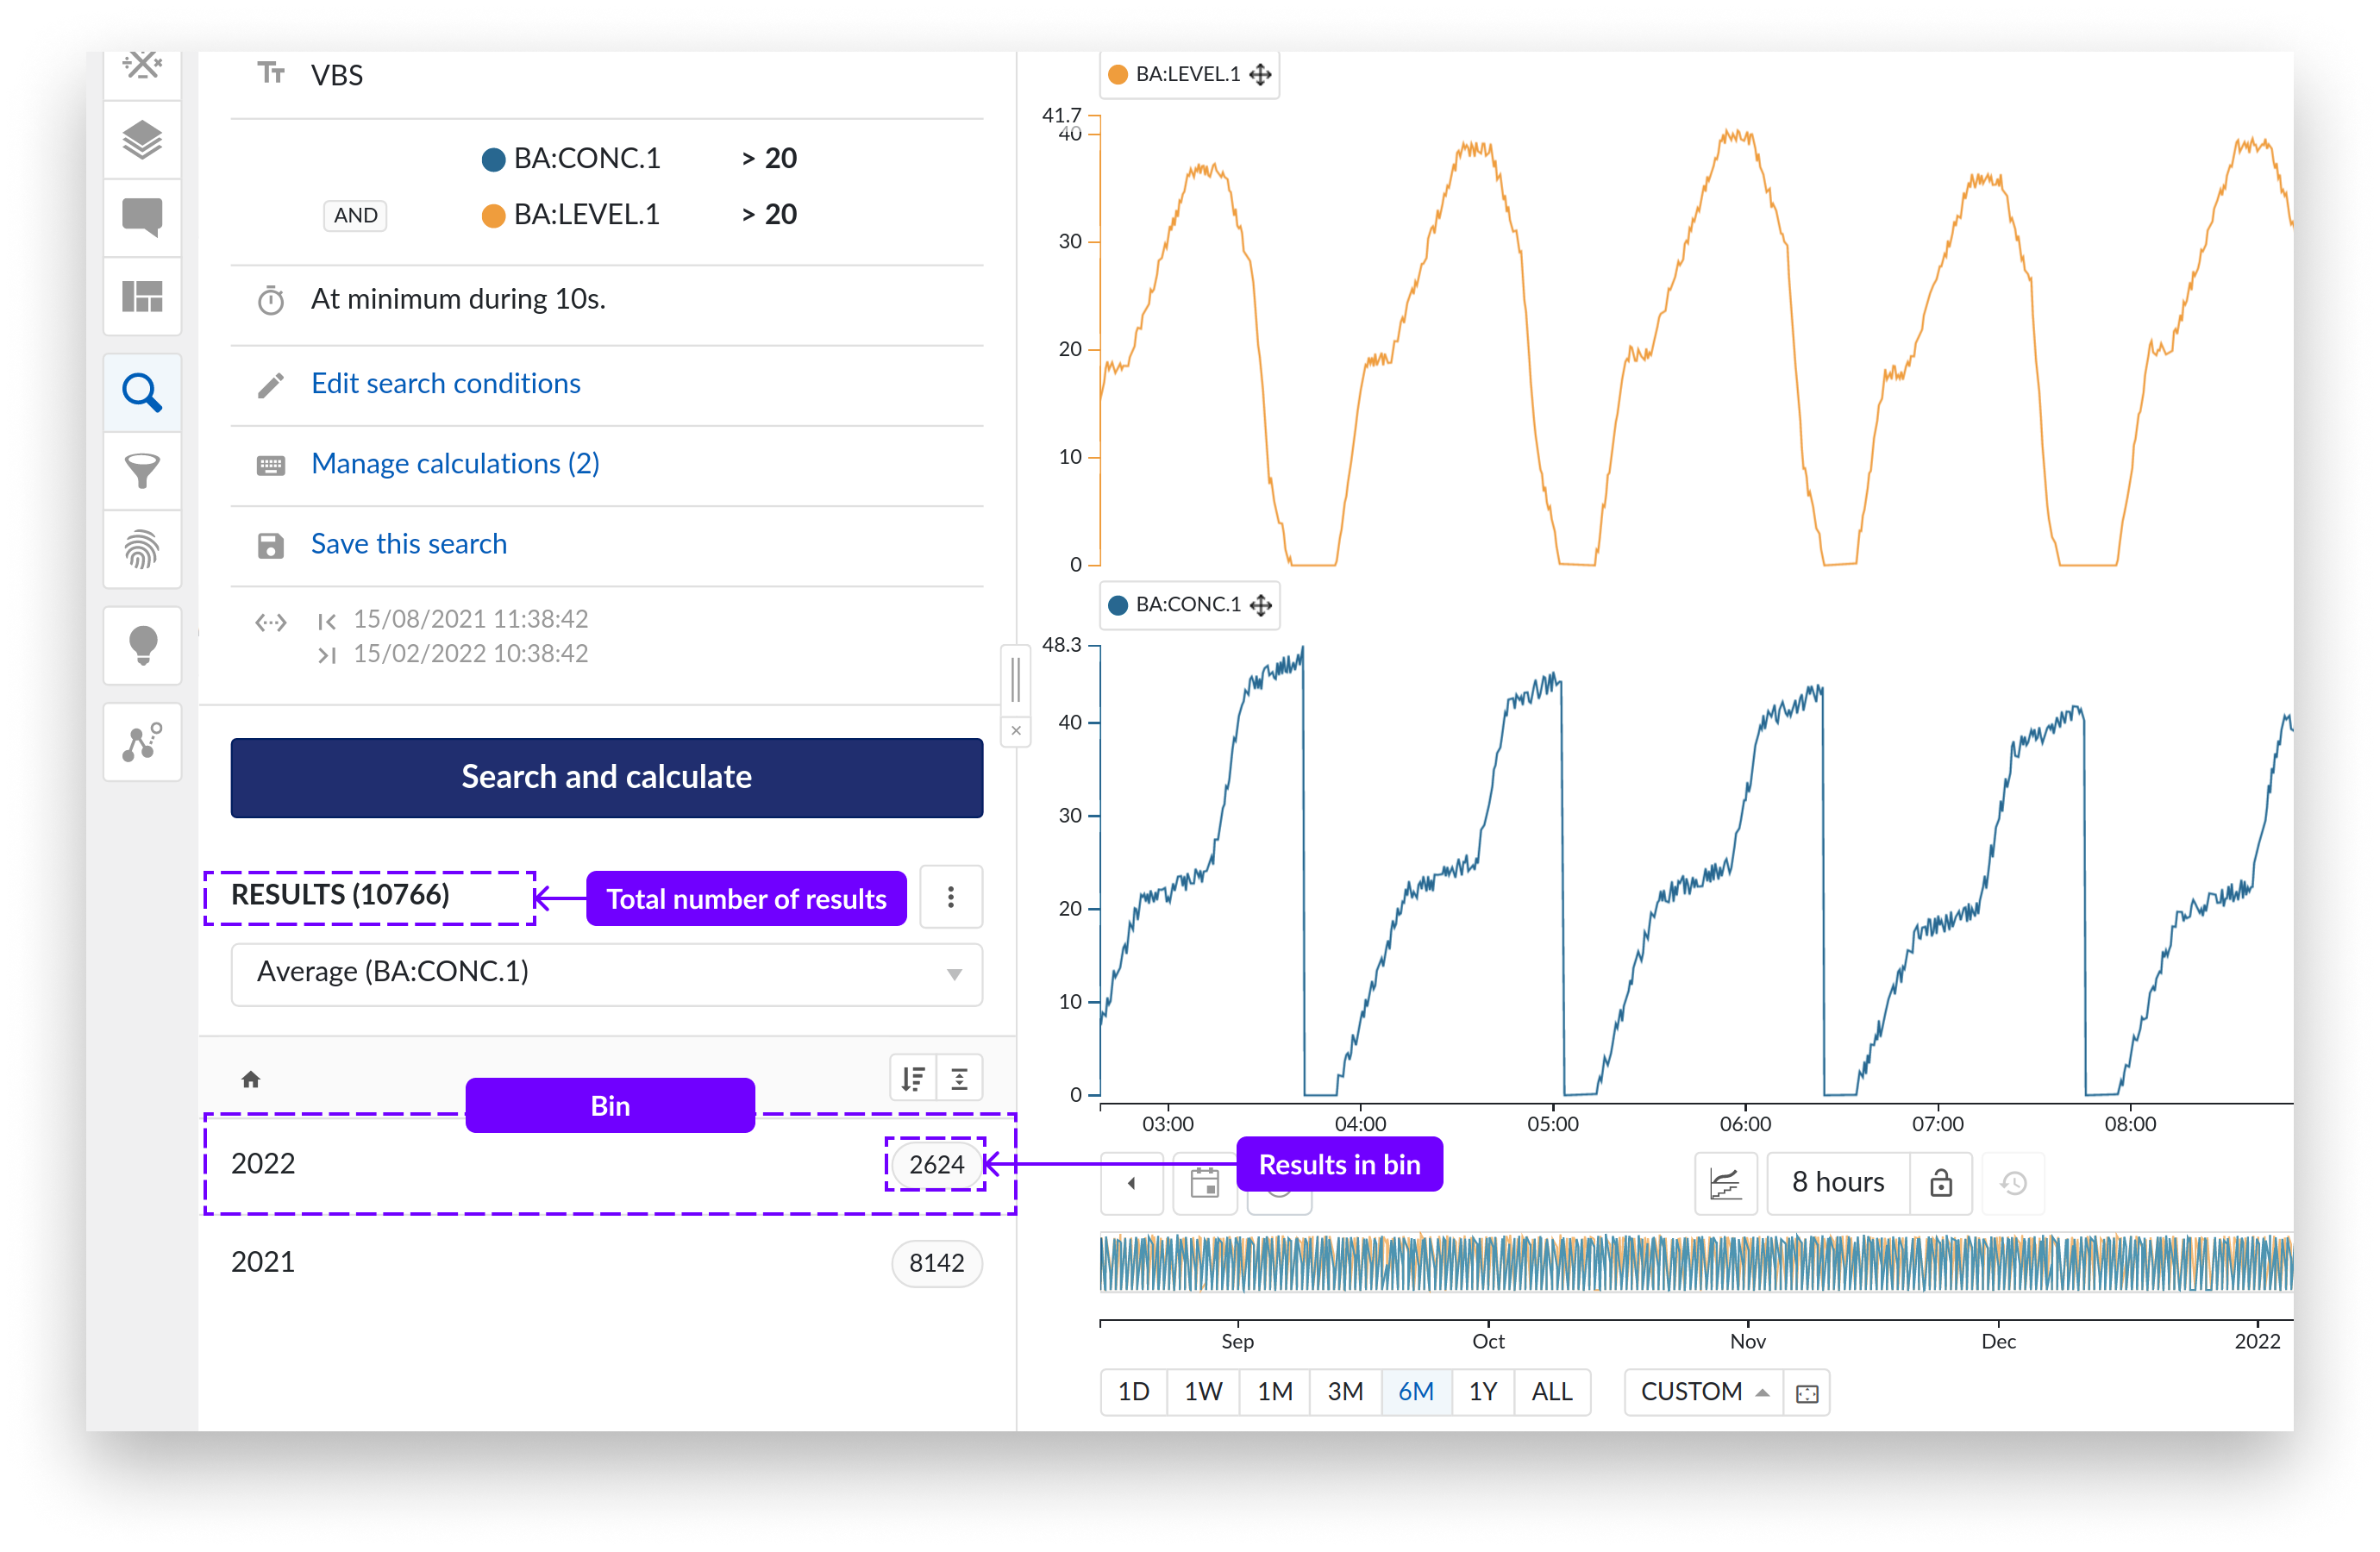
If your search returns more than 10 results, the results will be sorted into bins. The (binned) results are sorted by date (score in case of similarity search) and presented in descending order by default.
The total number of results is indicated in the result header and the number of results contained in each bin is indicated with a grey label on the corresponding bin.
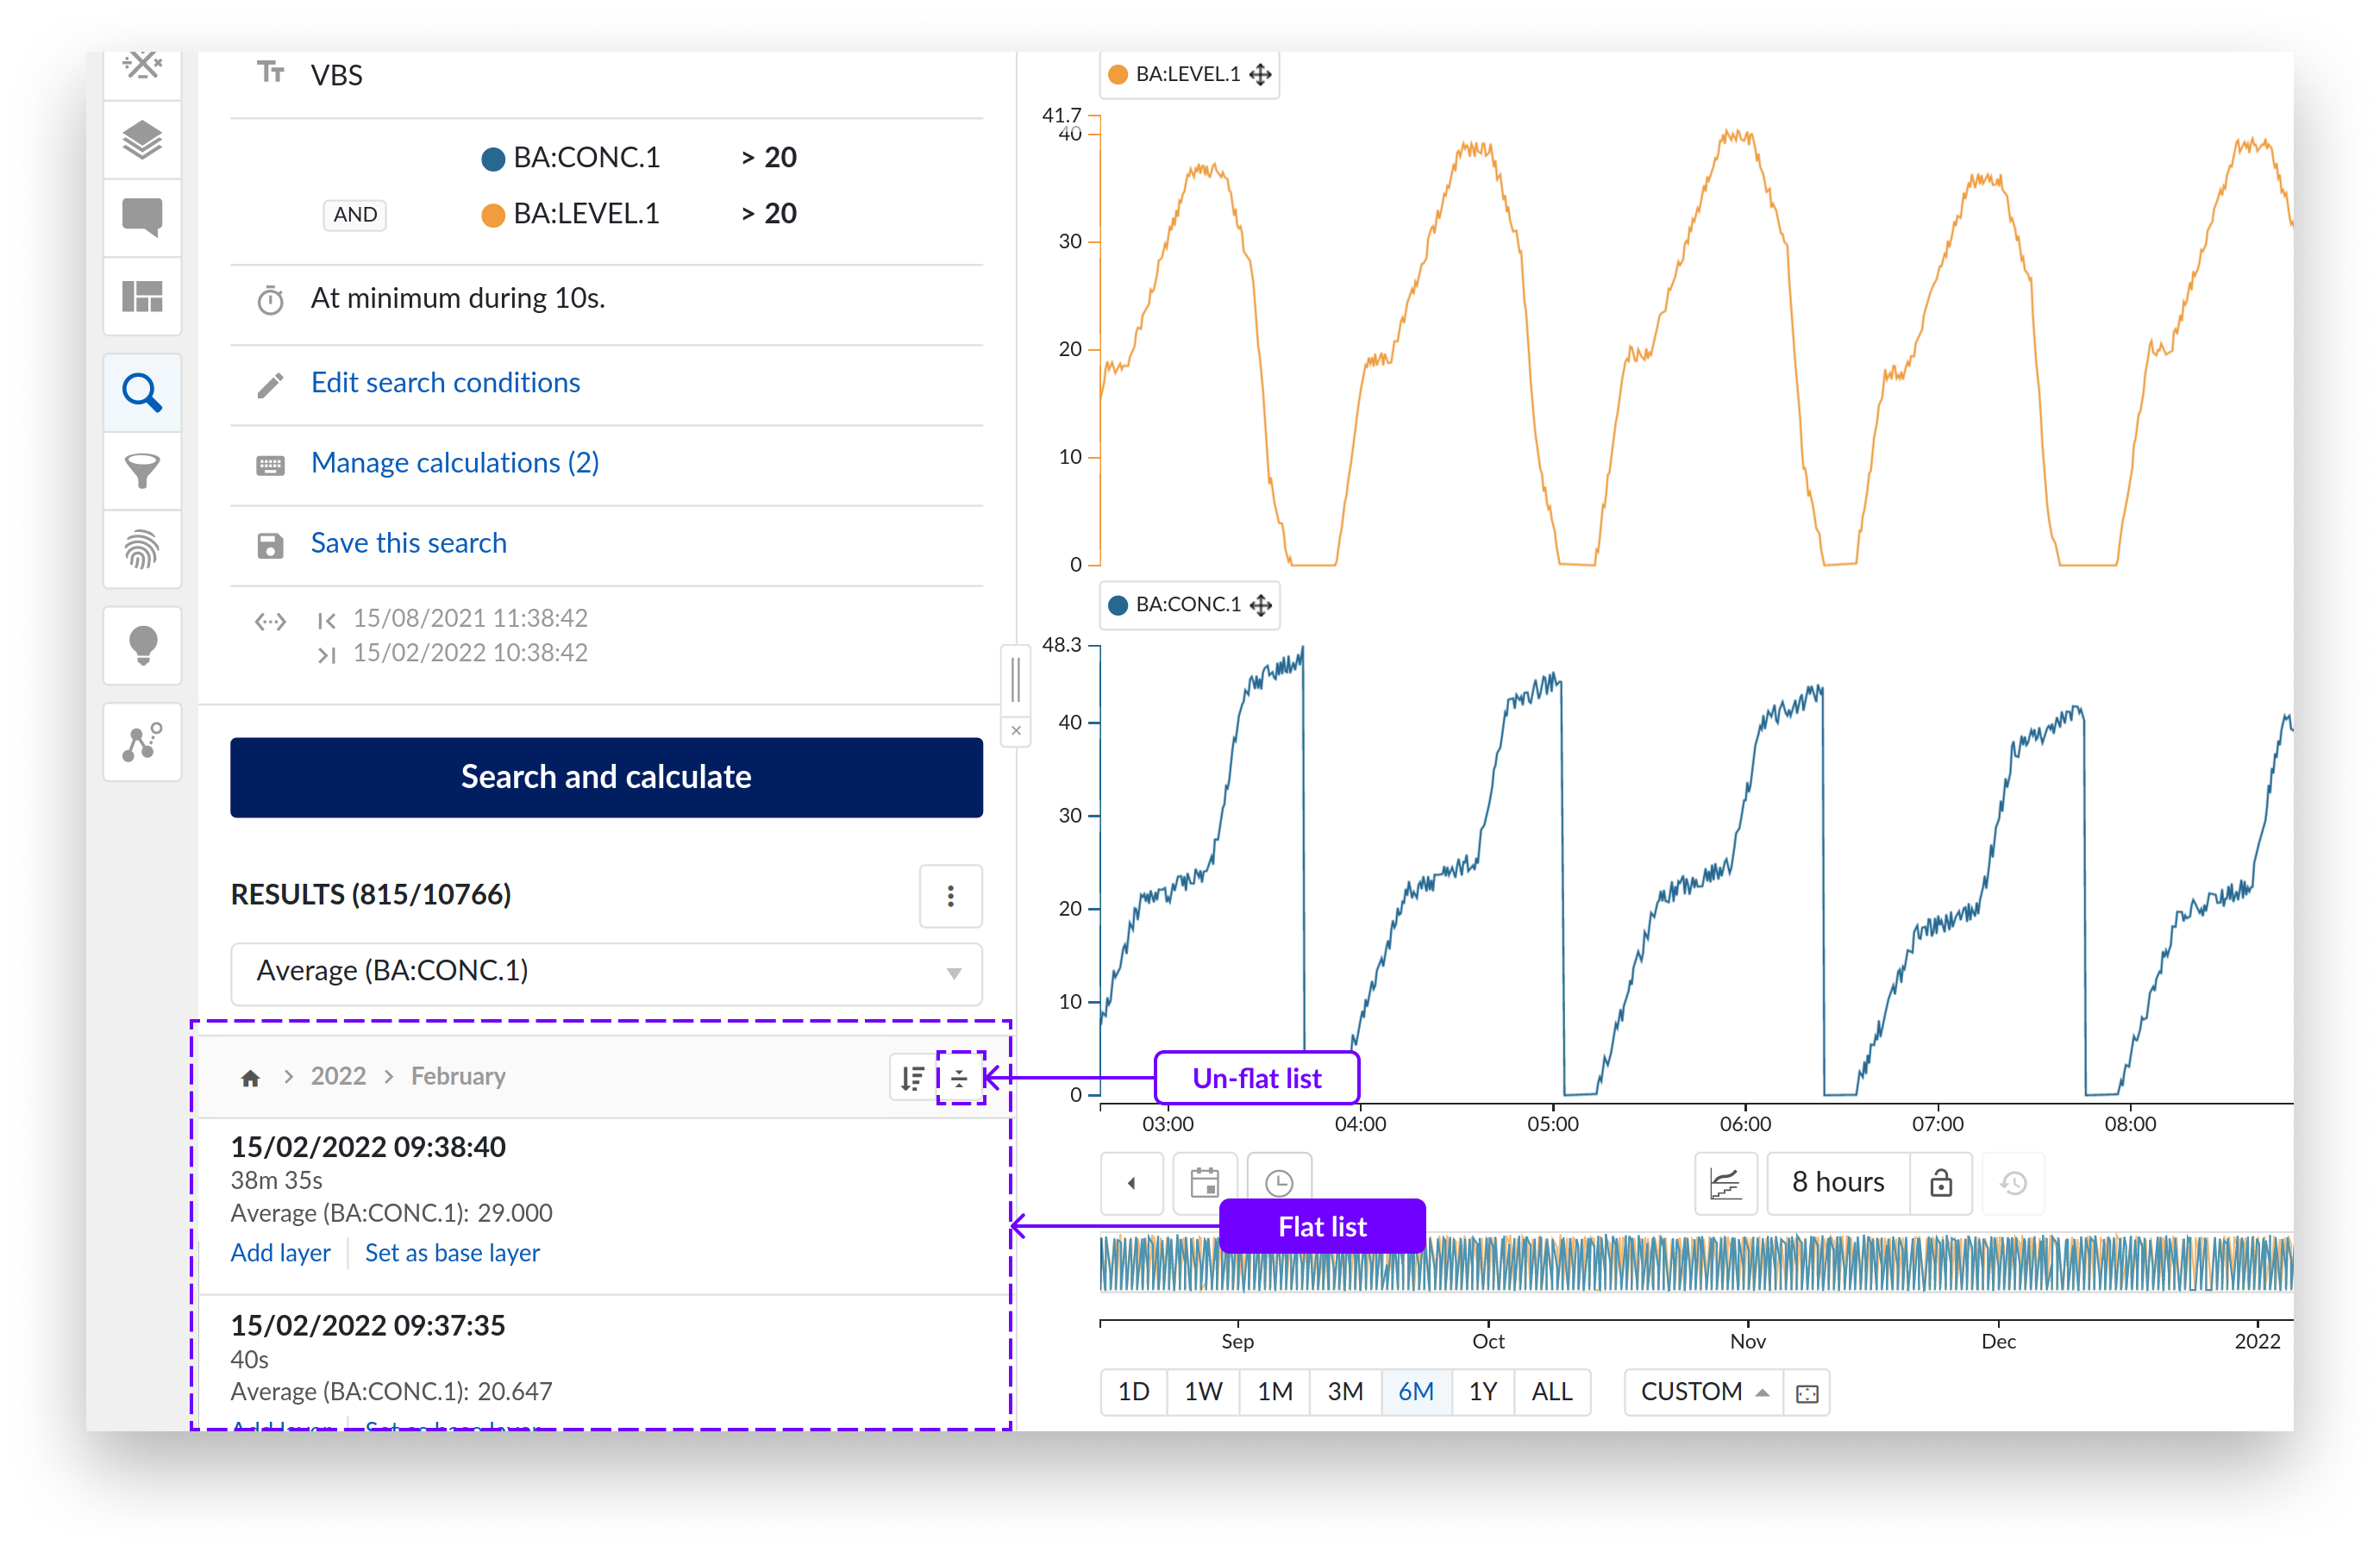
To visualize the search results at a specific bin level in 1 long list, click the flattening icon shown in the next screenshot. The flattening action will be applied to the bin and its sub-bins you are currently visualizing.
E.g., If you click the flattening button while you are in the February bin, all results of February will be visualized in 1 list.
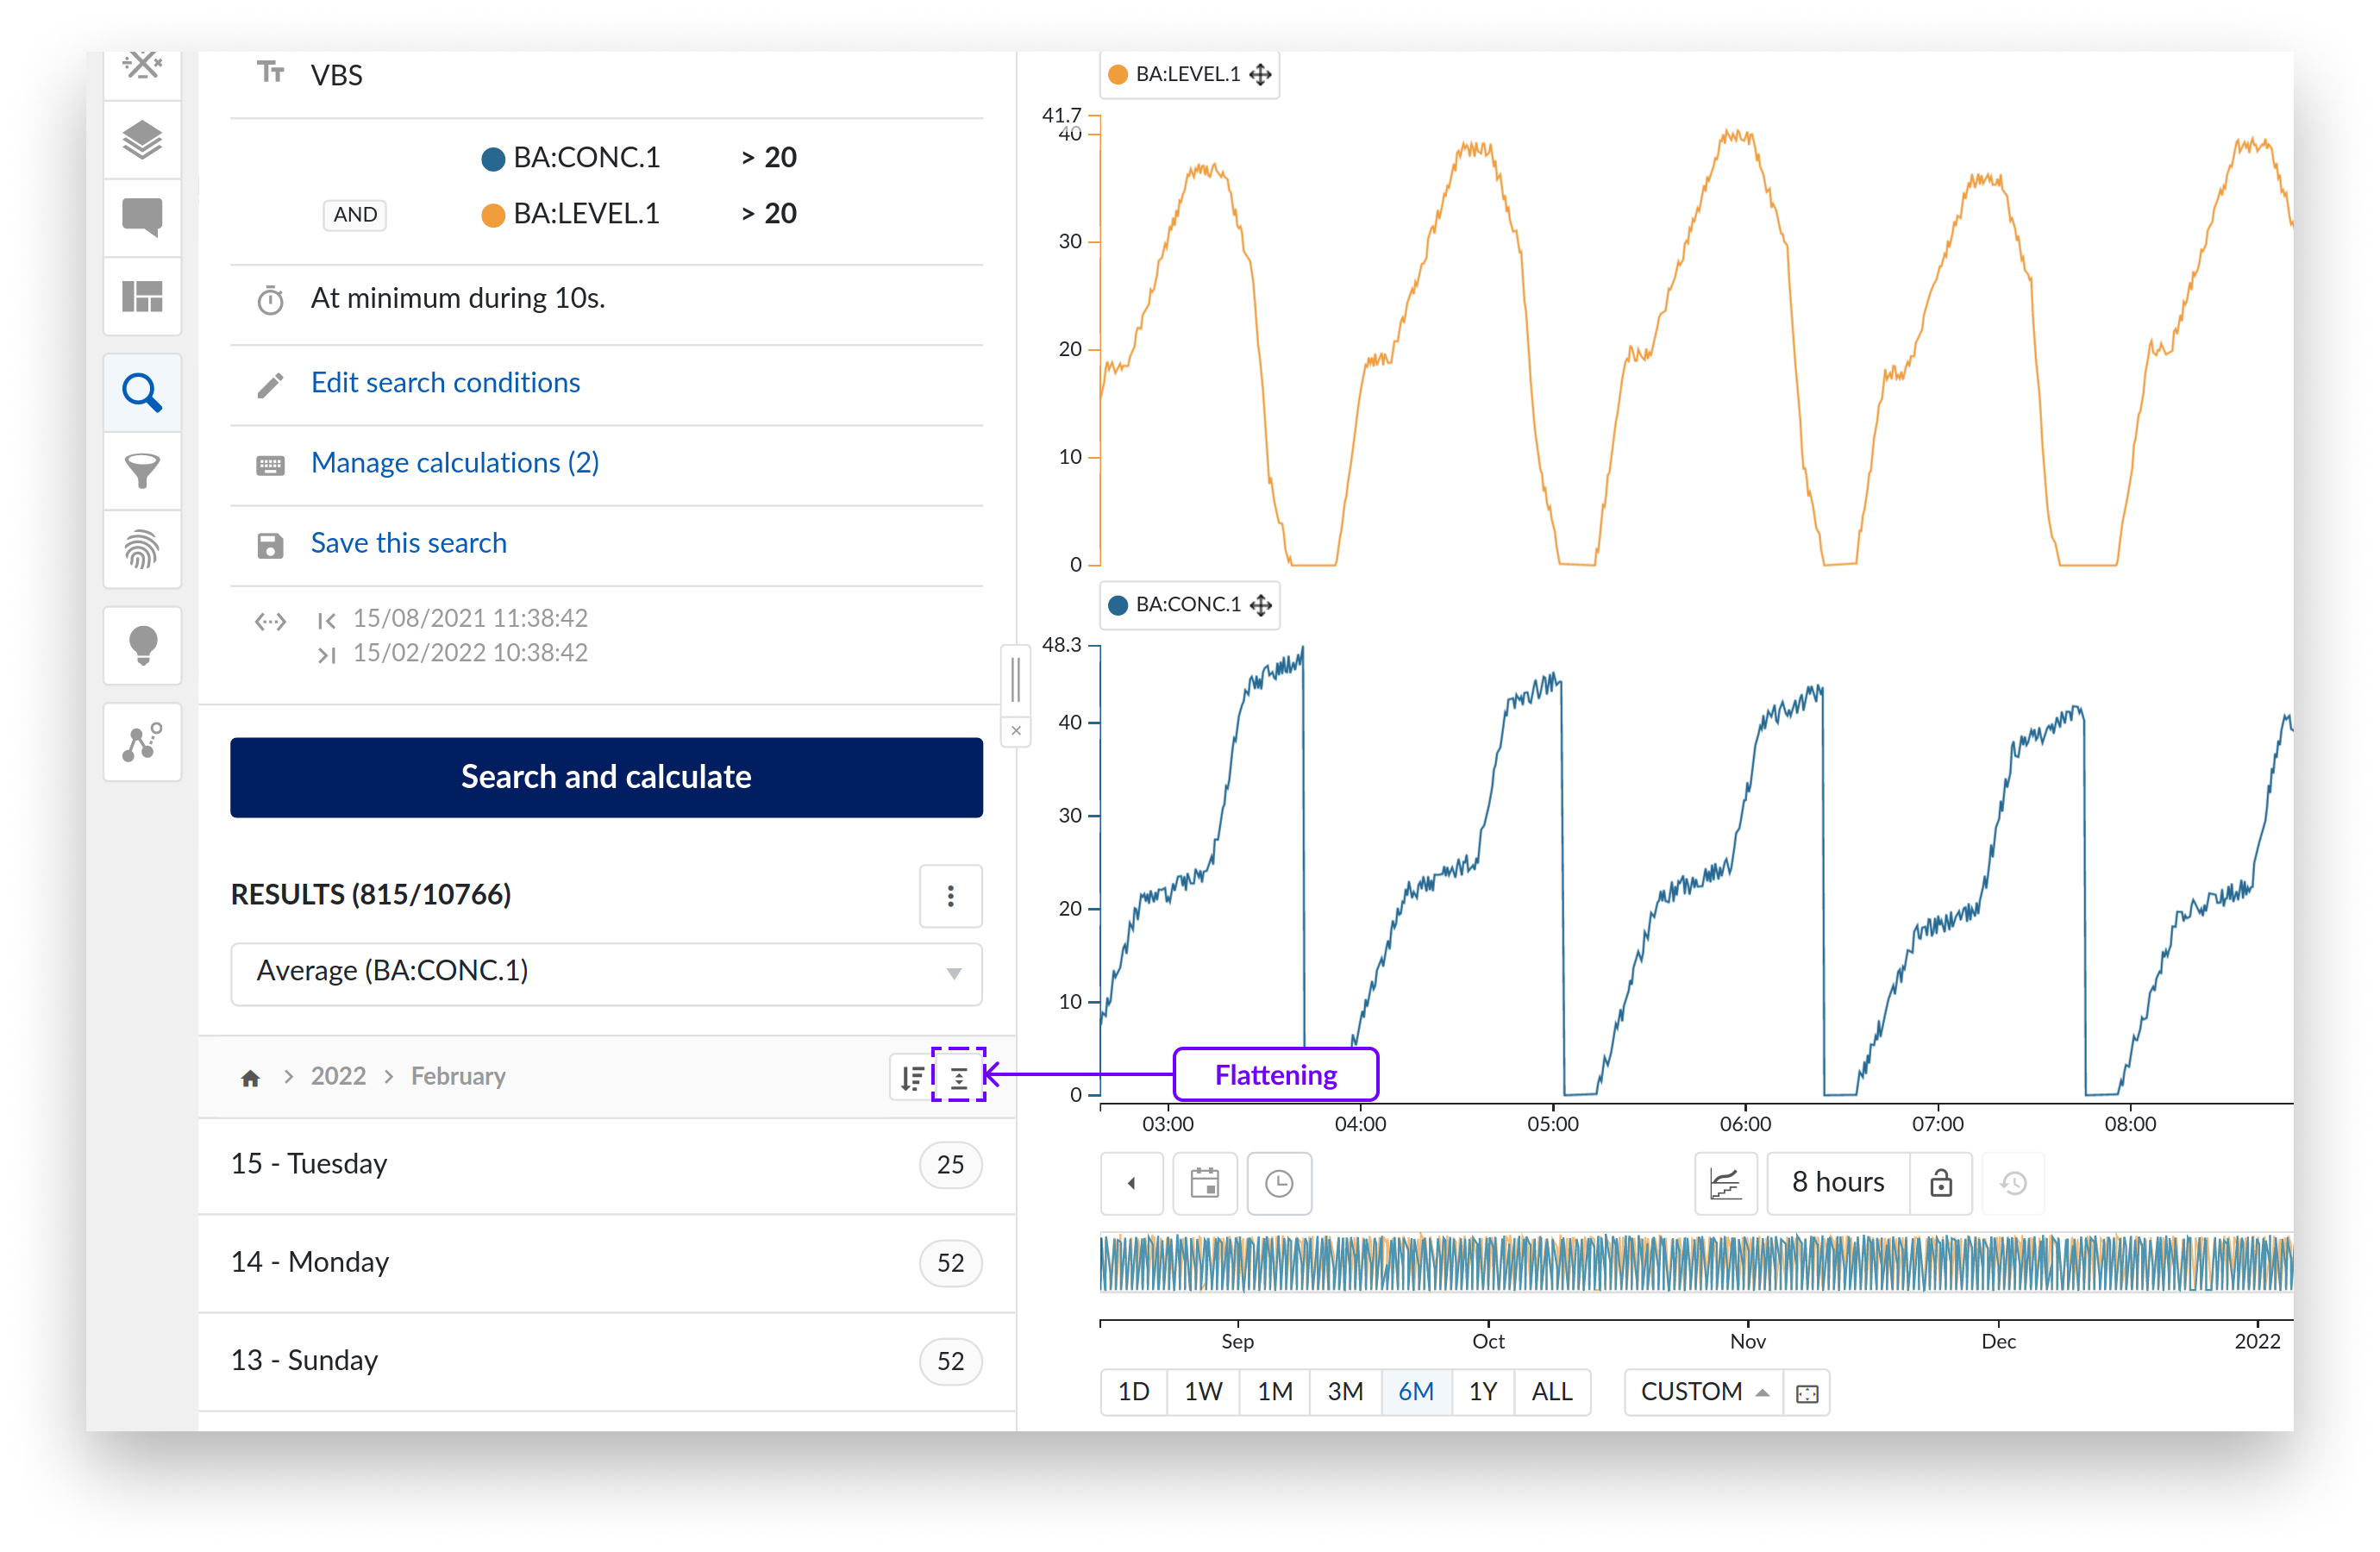
To see the February bins again, click the flattening button.
You can scroll the list until you find a period of interest. You can then select the results within the bins and explore the data graphically within the focus chart or perform other actions with the selected results, see Performing actions with the search results below.
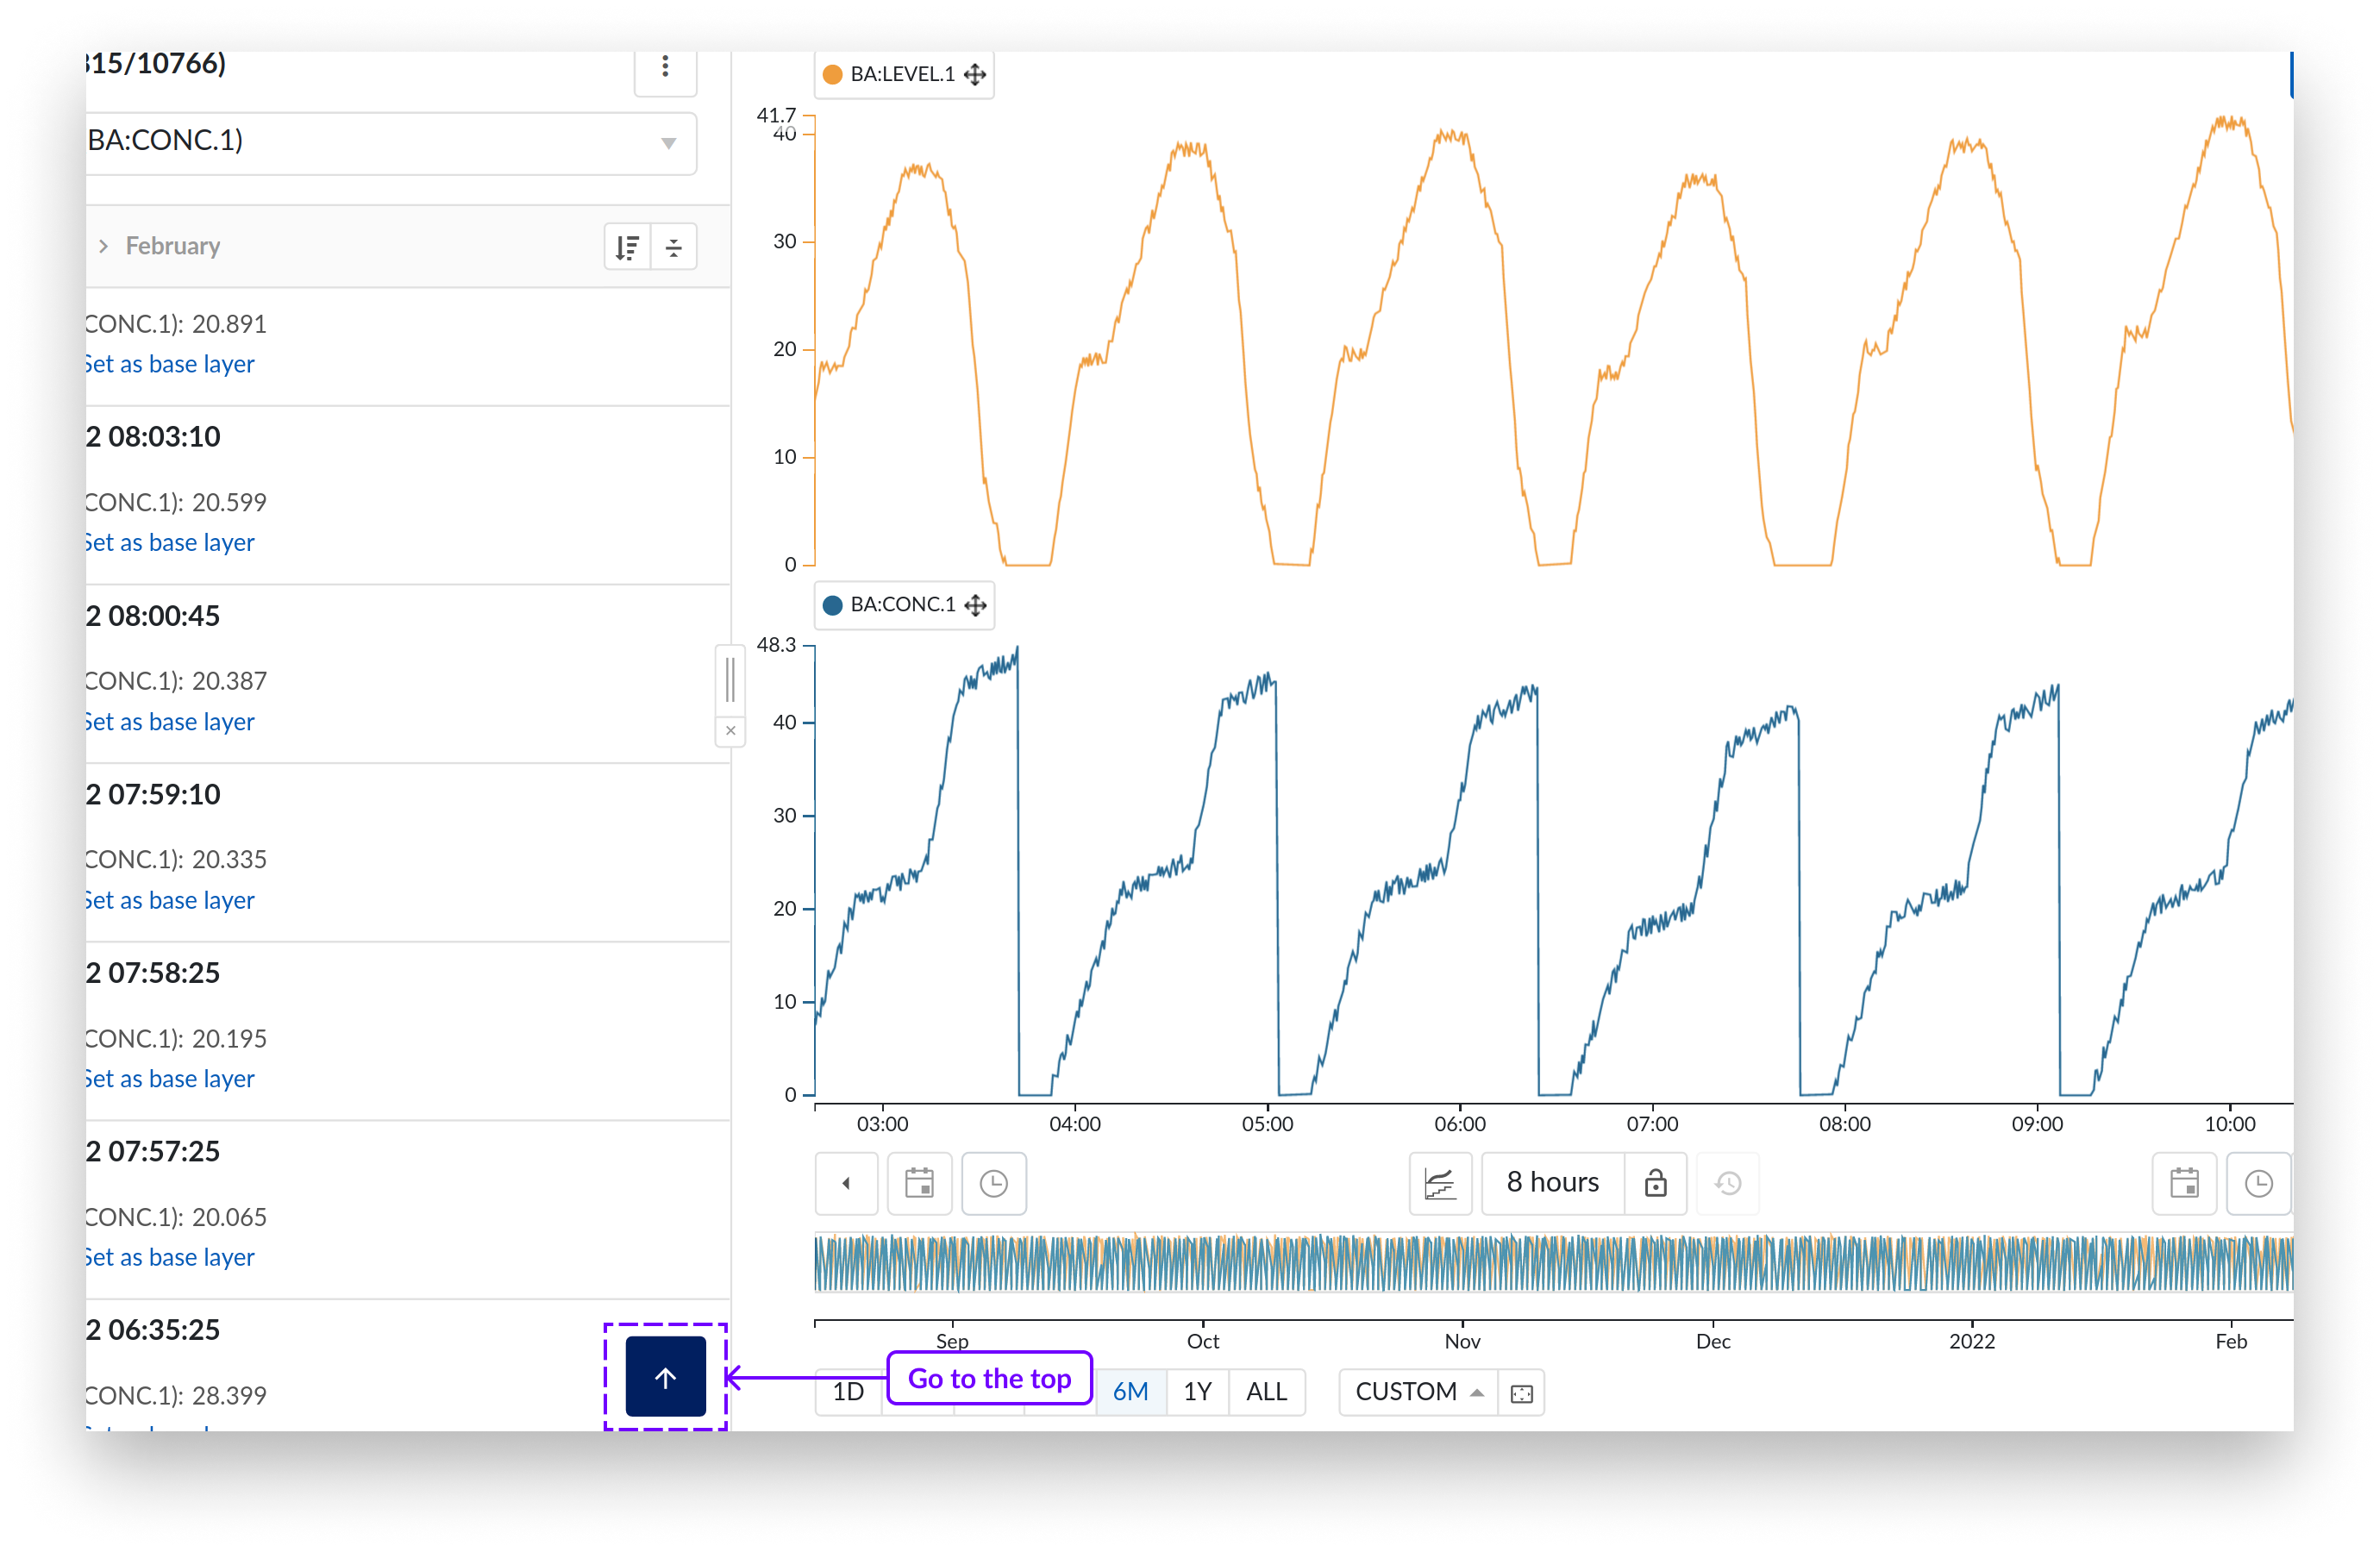
To move up in the results list, use the navigate up icon at the bottom right of the results.
Sorting search results
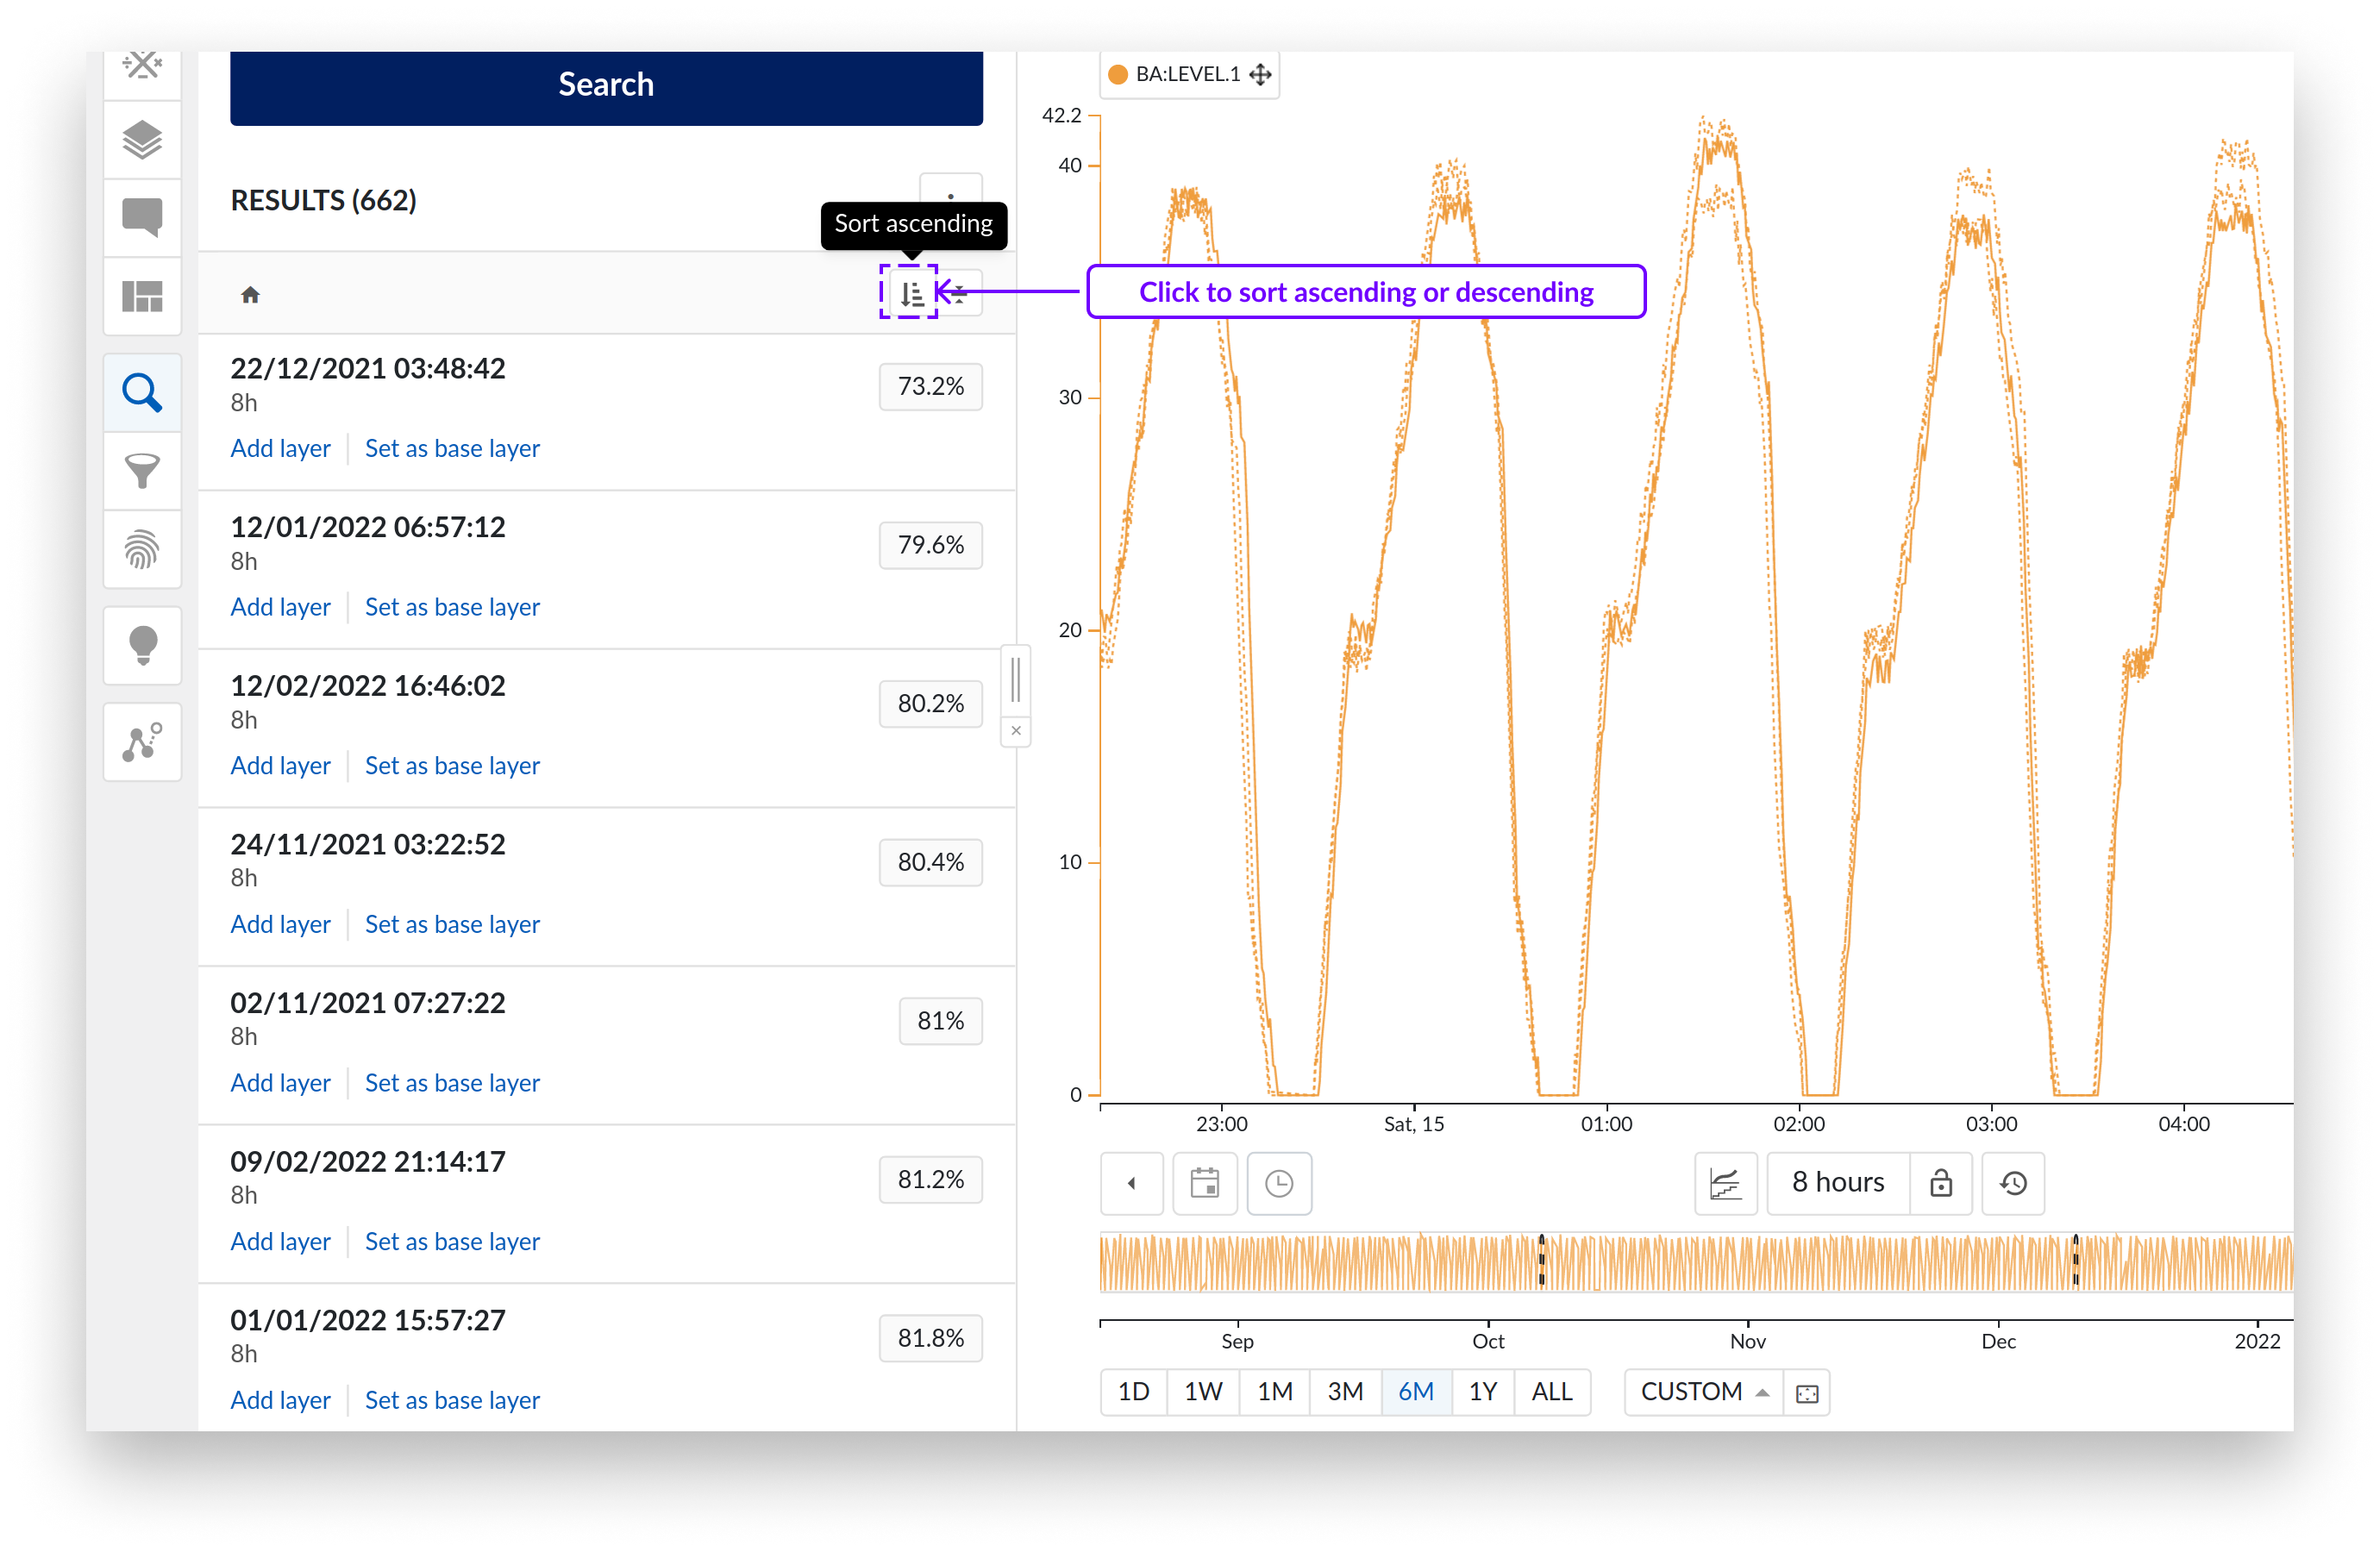
You can sort the results ascending or descending, by clicking on the sorting icon shown in the next image. The arrow is always displayed down, and the bars will indicate if the results as sorted descending or ascending.
To change the sorting mode of the results, click the three vertical dots icon situated at the top right corner of the results list. Depending on the search dimension, different sorting options are available:
Similarity search: sort by score or date.
Value based search: sort by date or duration.
Digital step search: sort by date.
Context Item search: sort by date or duration.
Operating Area search: sort by date or duration.
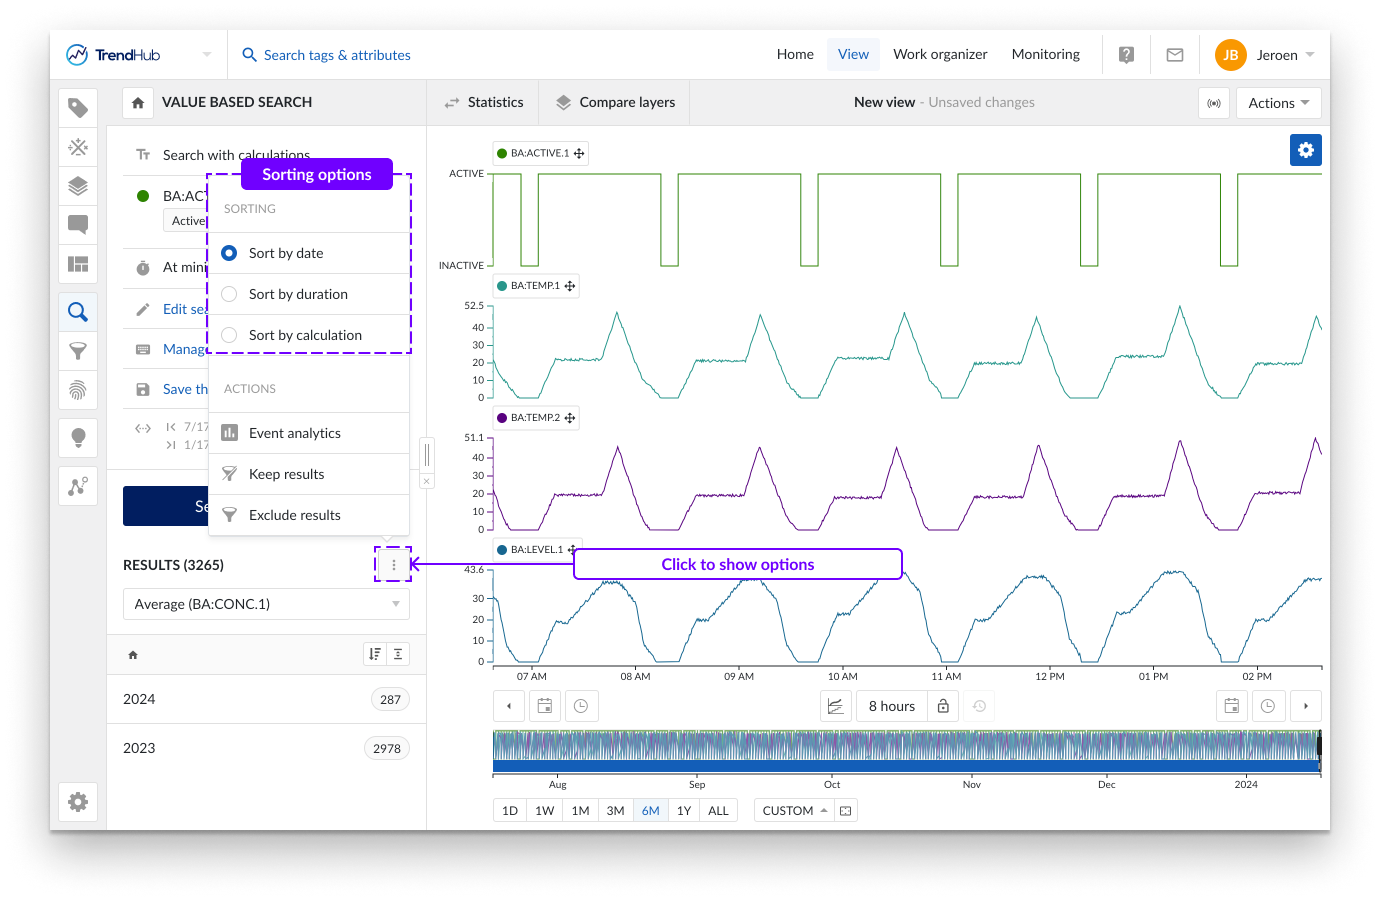
When you perform a calculation on the search results (refer to Calculations on Search results document), an additional option to sort the results by calculation is provided.
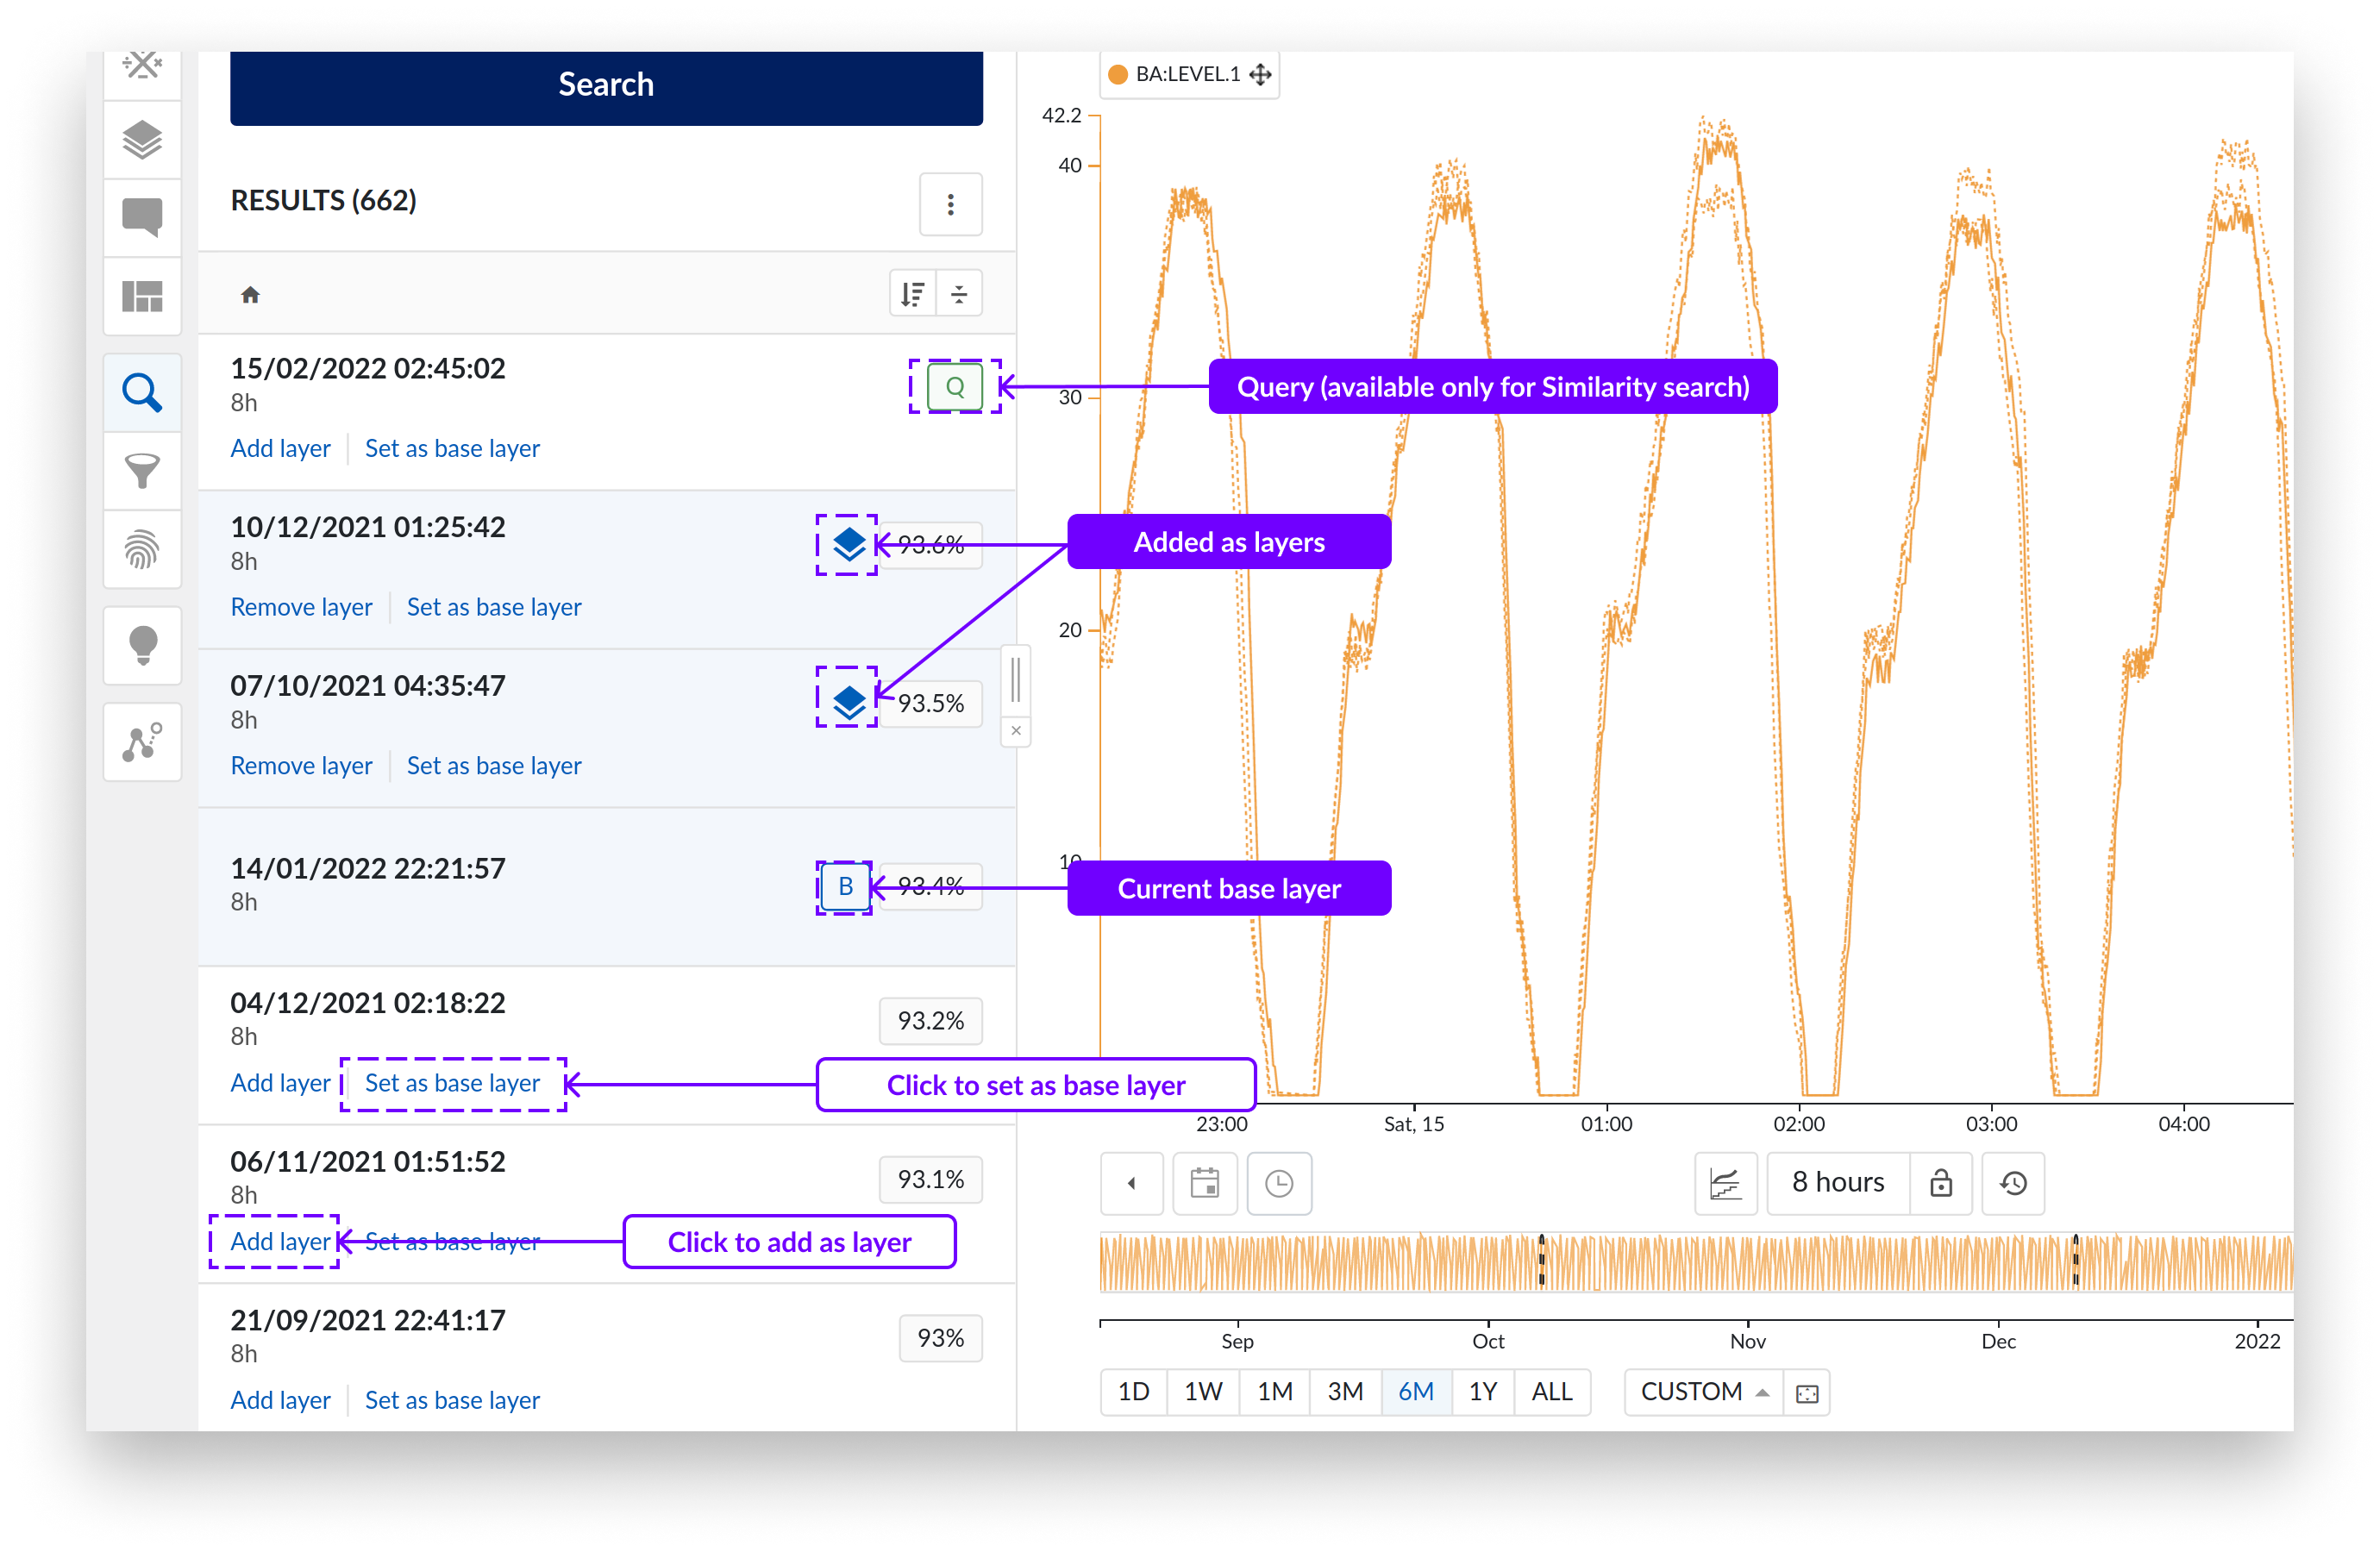
There are two options you can use to visualize individual results:
Click on “Set as base layer” to replace the focus layers by the corresponding time period of the result. The result will become the base layer (B) and other layers will be removed.
Click on “Add layer” to add the corresponding time period of the result as a new layer (lay it on top of the base layer). Overlays can be removed again by clicking on “Remove layer.”
Note
For a similarity search, the query time period (original period you started from) will always be shown with a “Q” icon.
Besides the sorting options, the following actions are available for the search results when clicking the three vertical dot icon.
Keep results / Exclude results
With this option you can filter out specific search results or keep certain search results.
This is done by creating filters for the periods between the search results (Keep results) or to create filters for those search result periods (Exclude results).
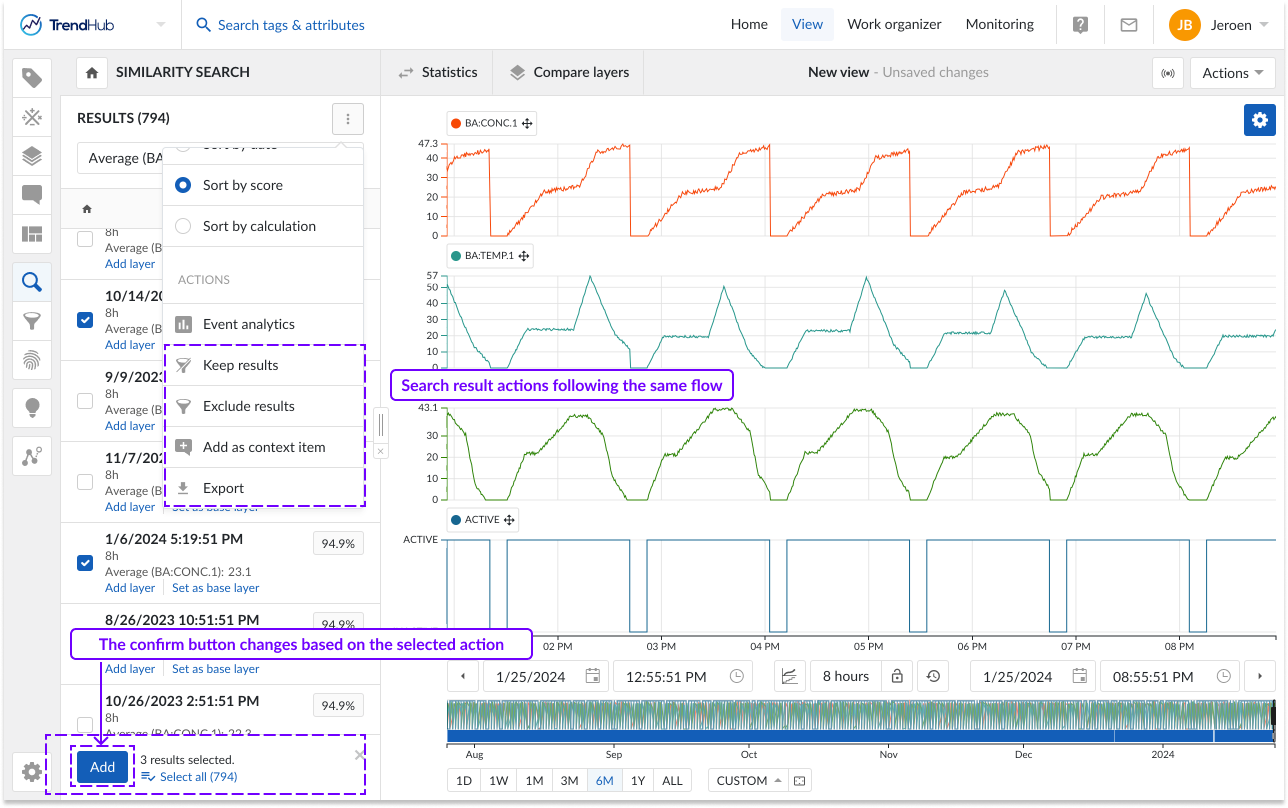
Add as context item
With the "Add as context item" option, you can create context items for all the selected search results.
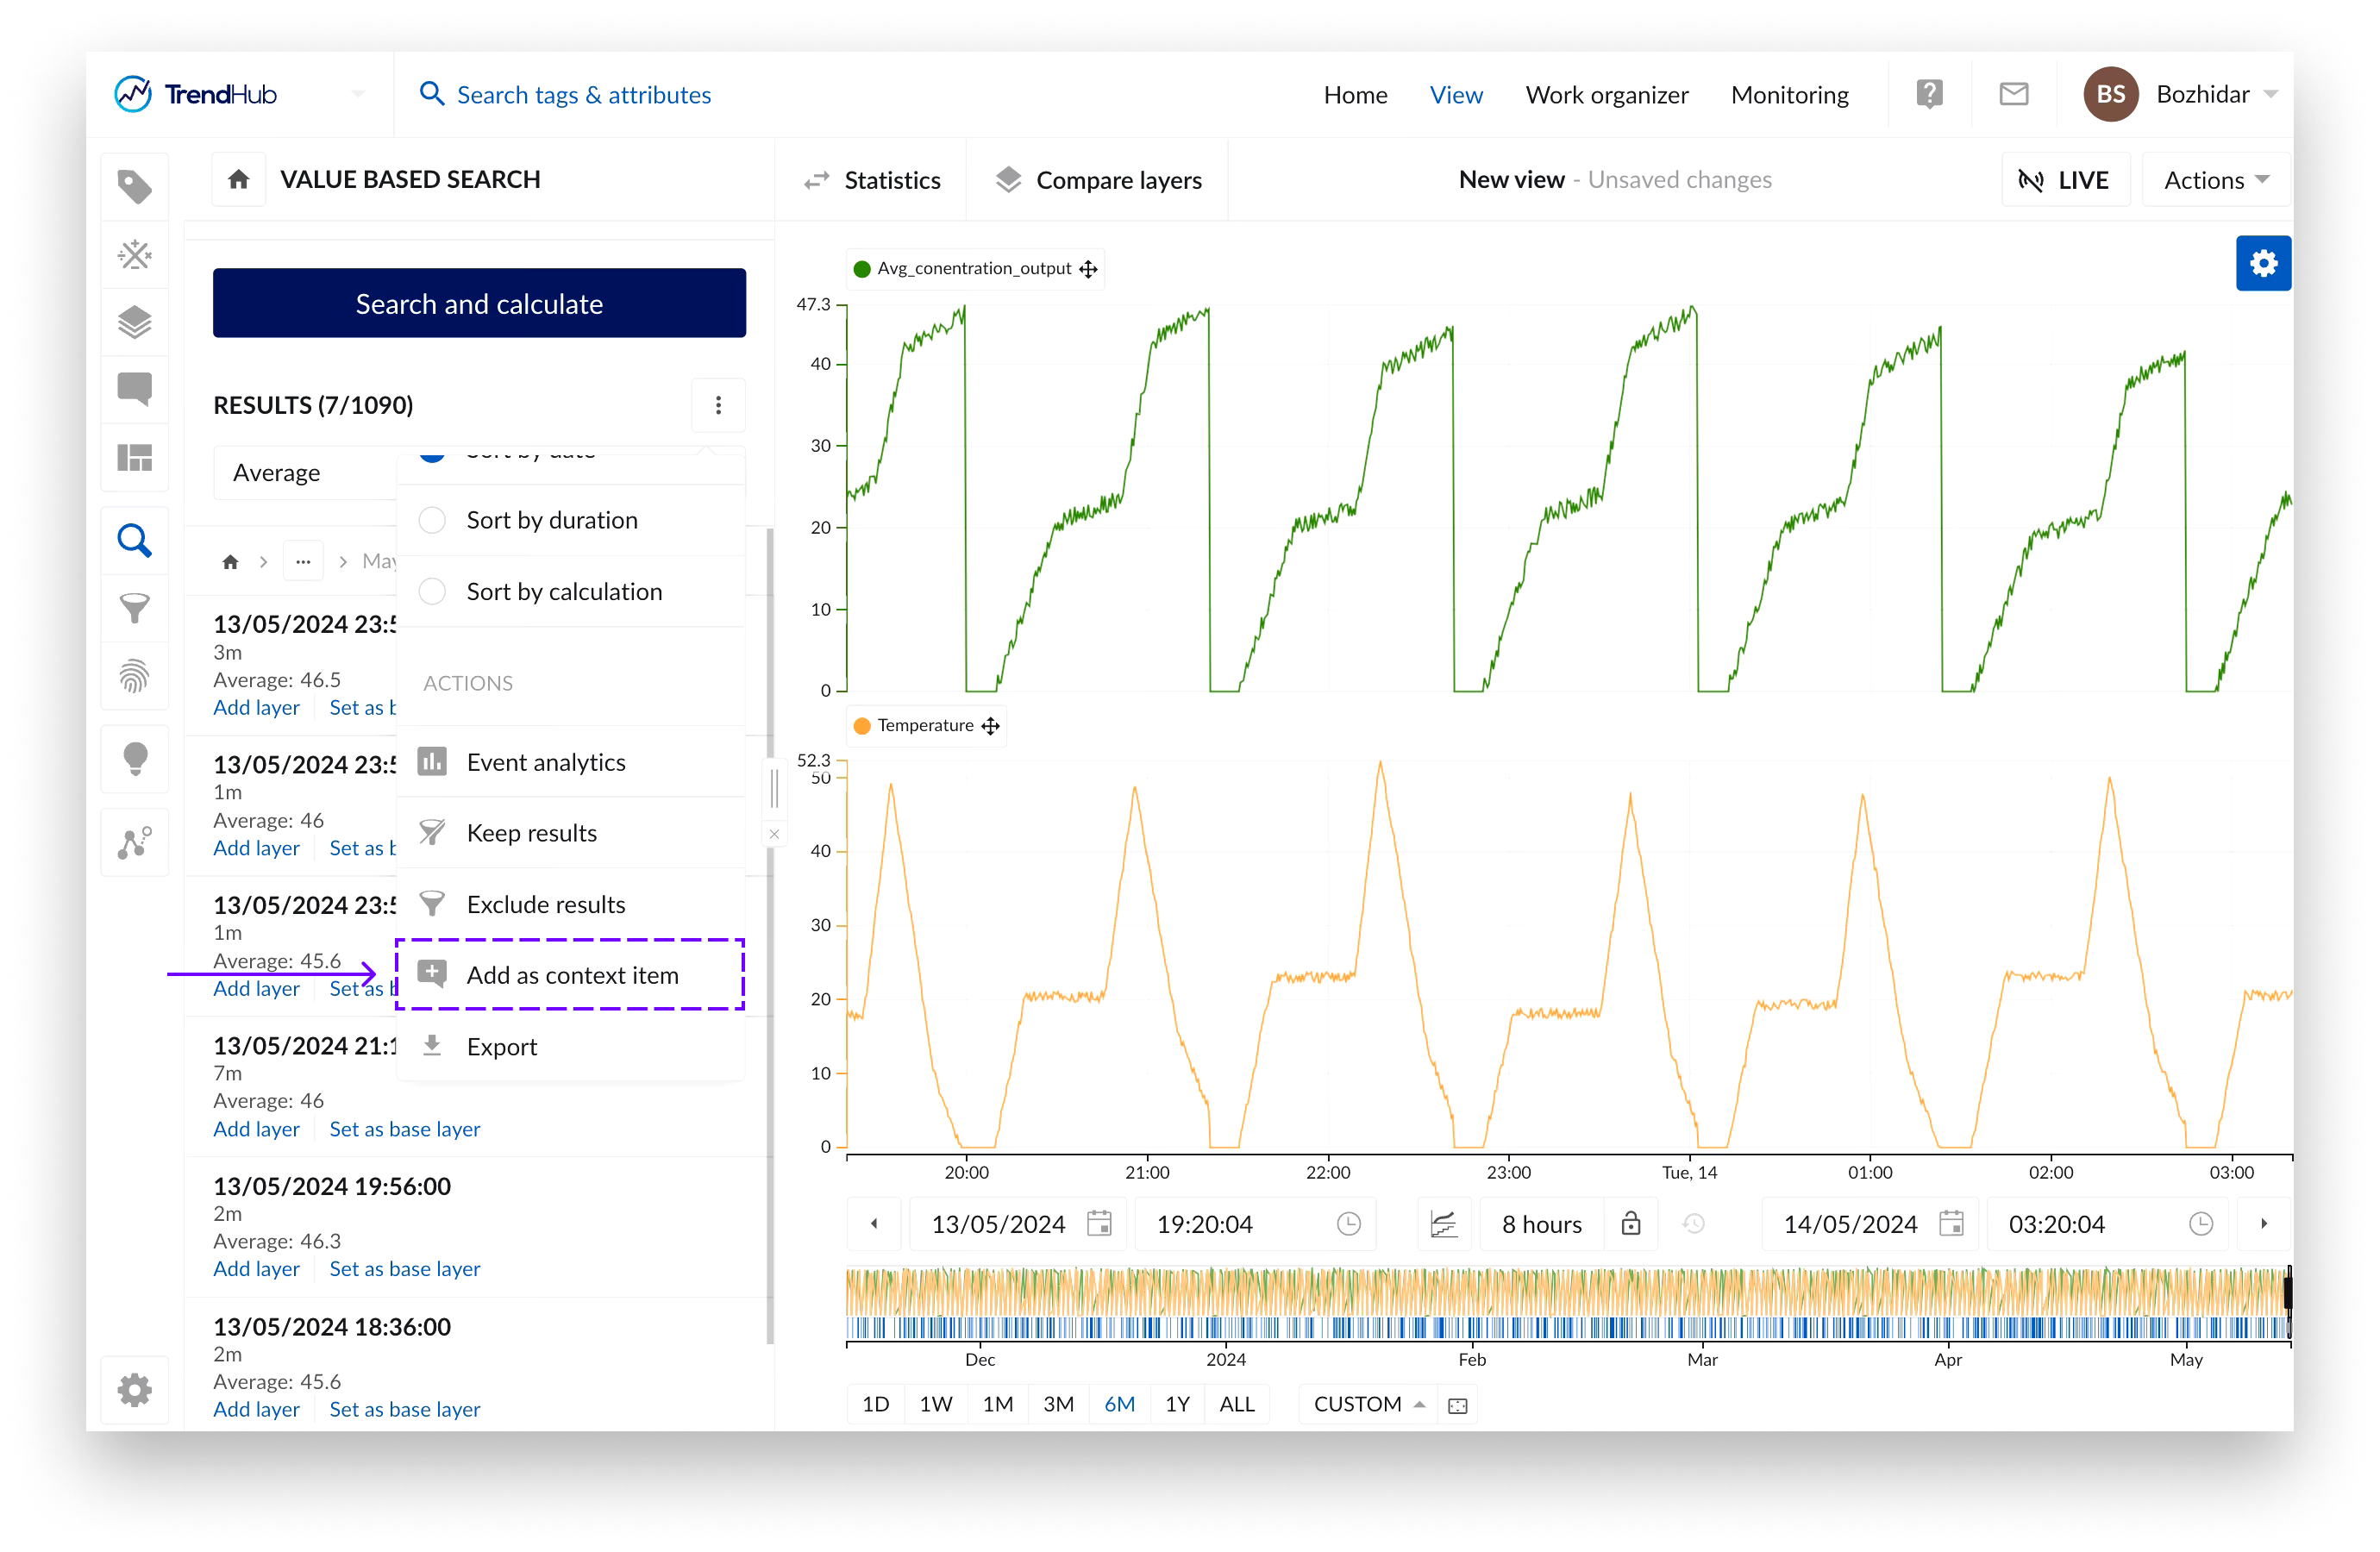
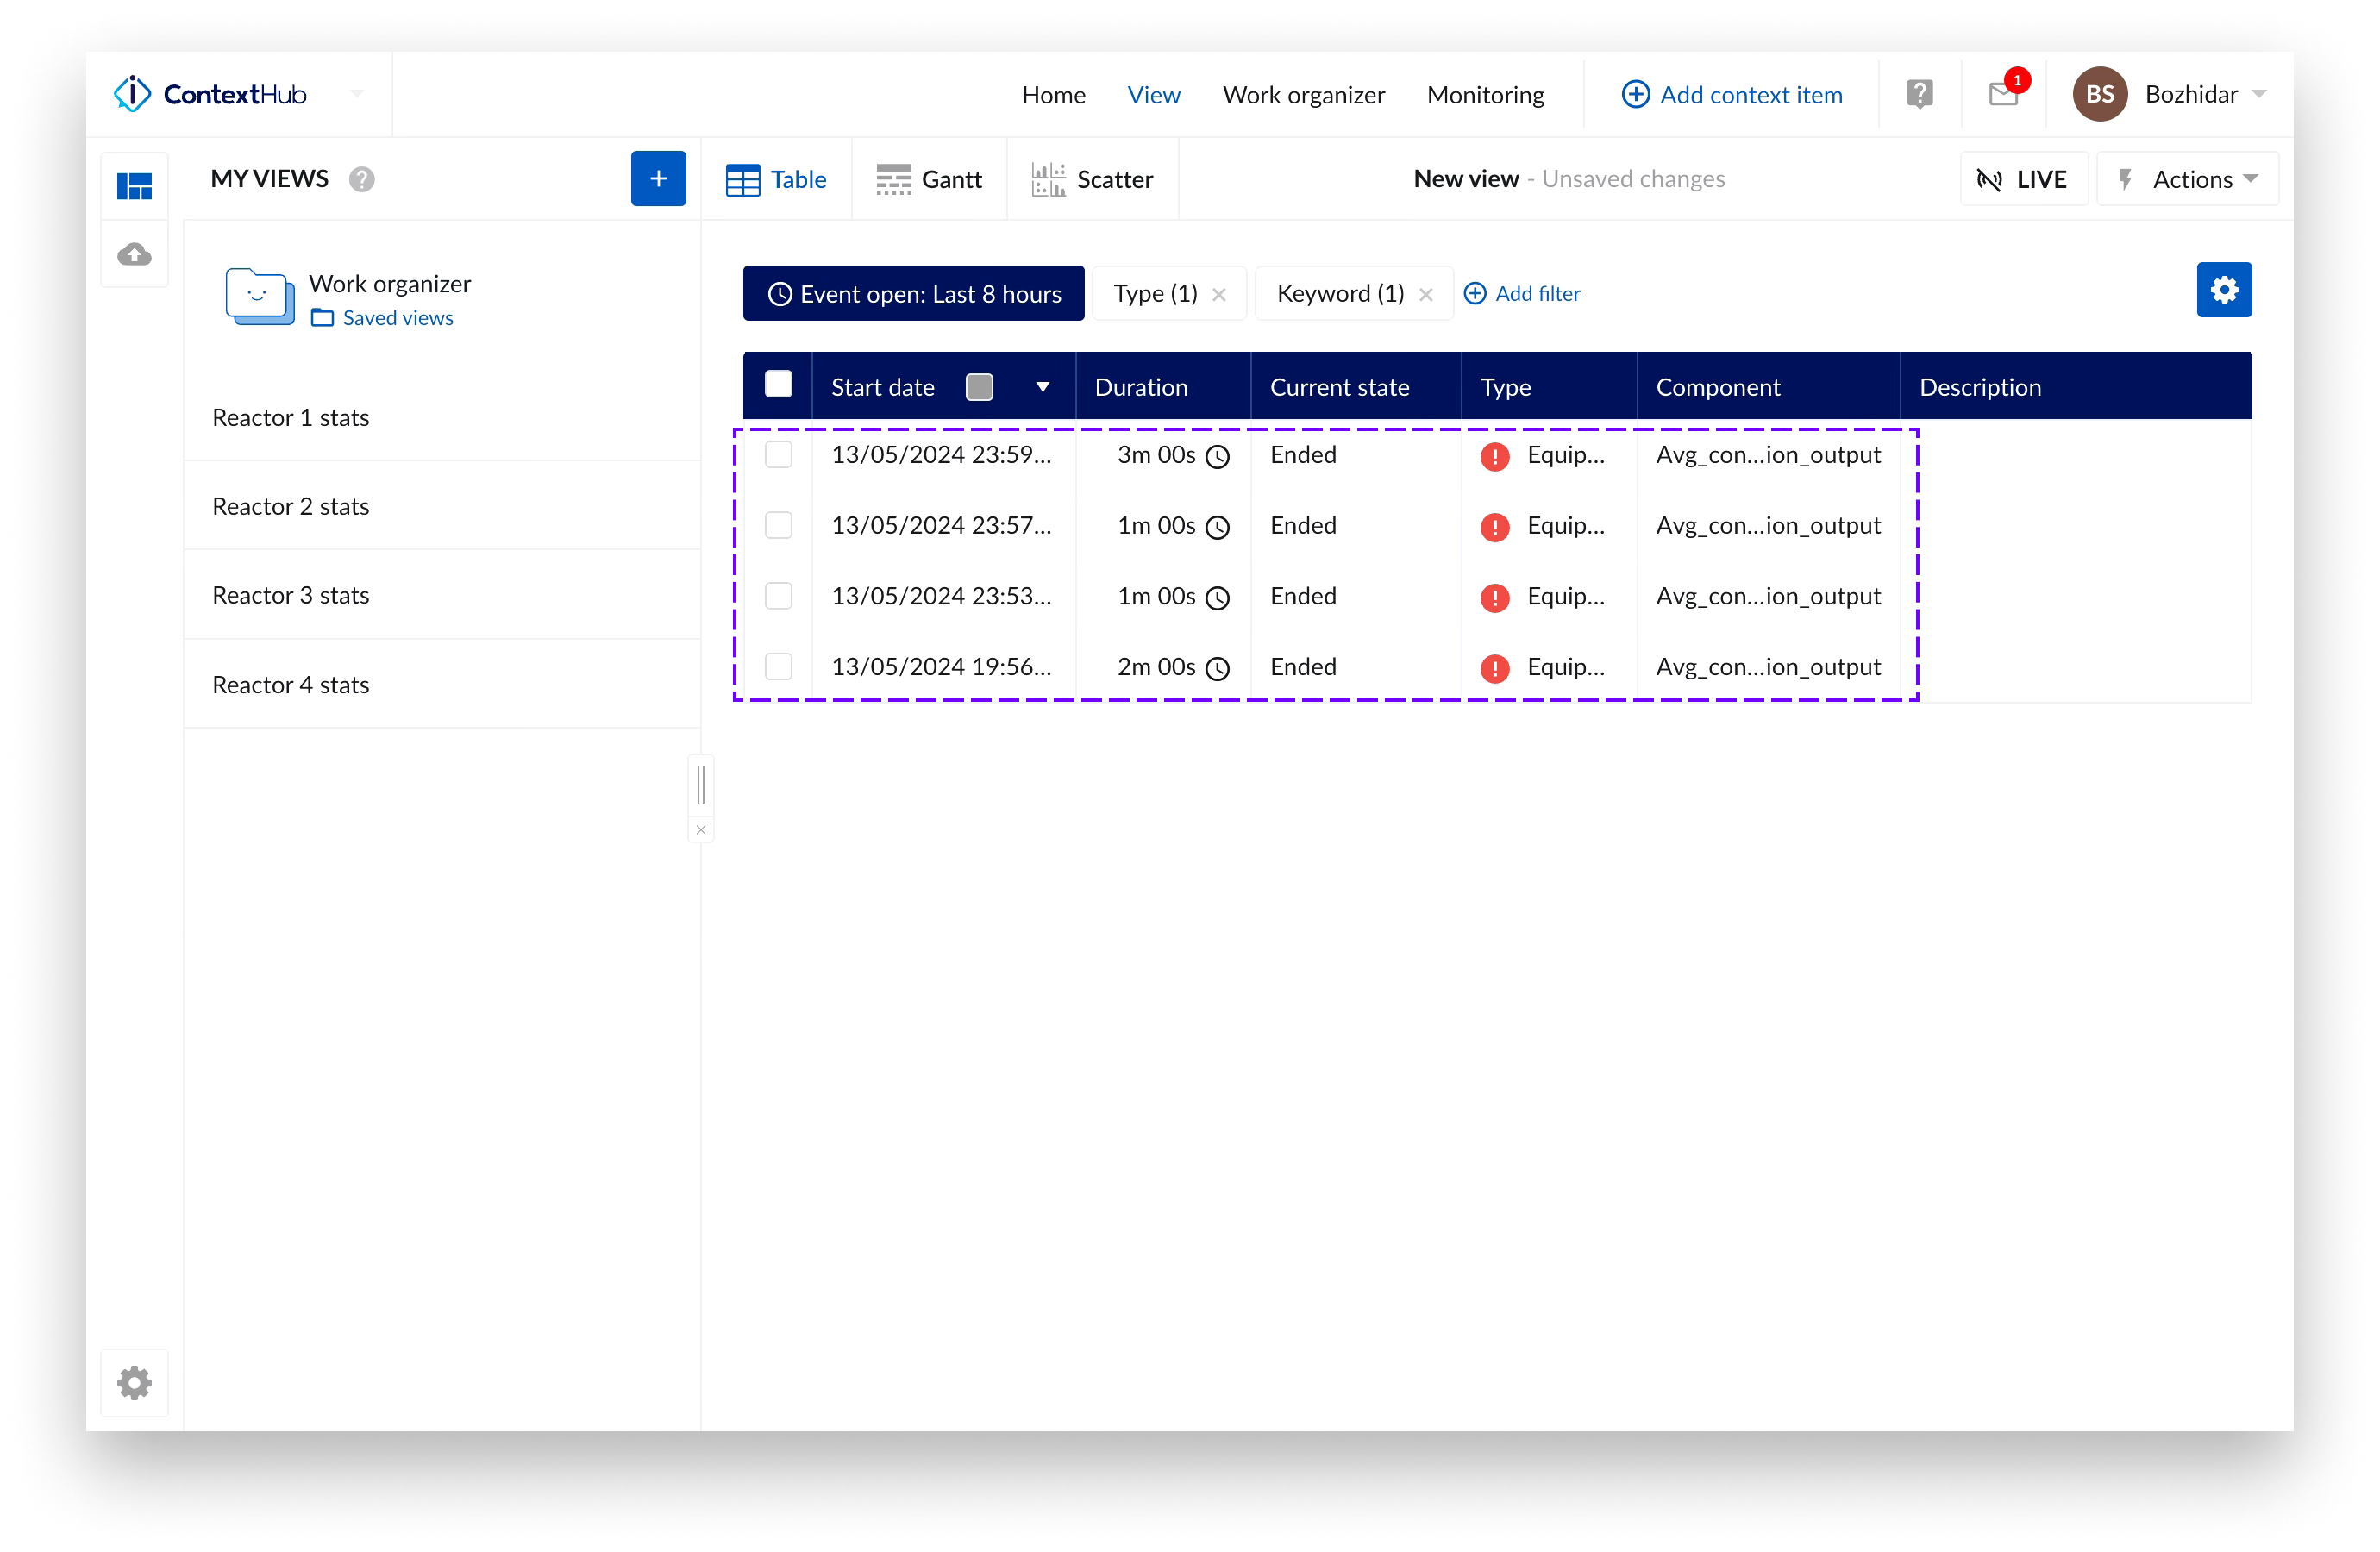
You can choose a subset of the available search results by selecting the corresponding check boxes. Also note that configured calculations also appear in the list of search results with their respective value.
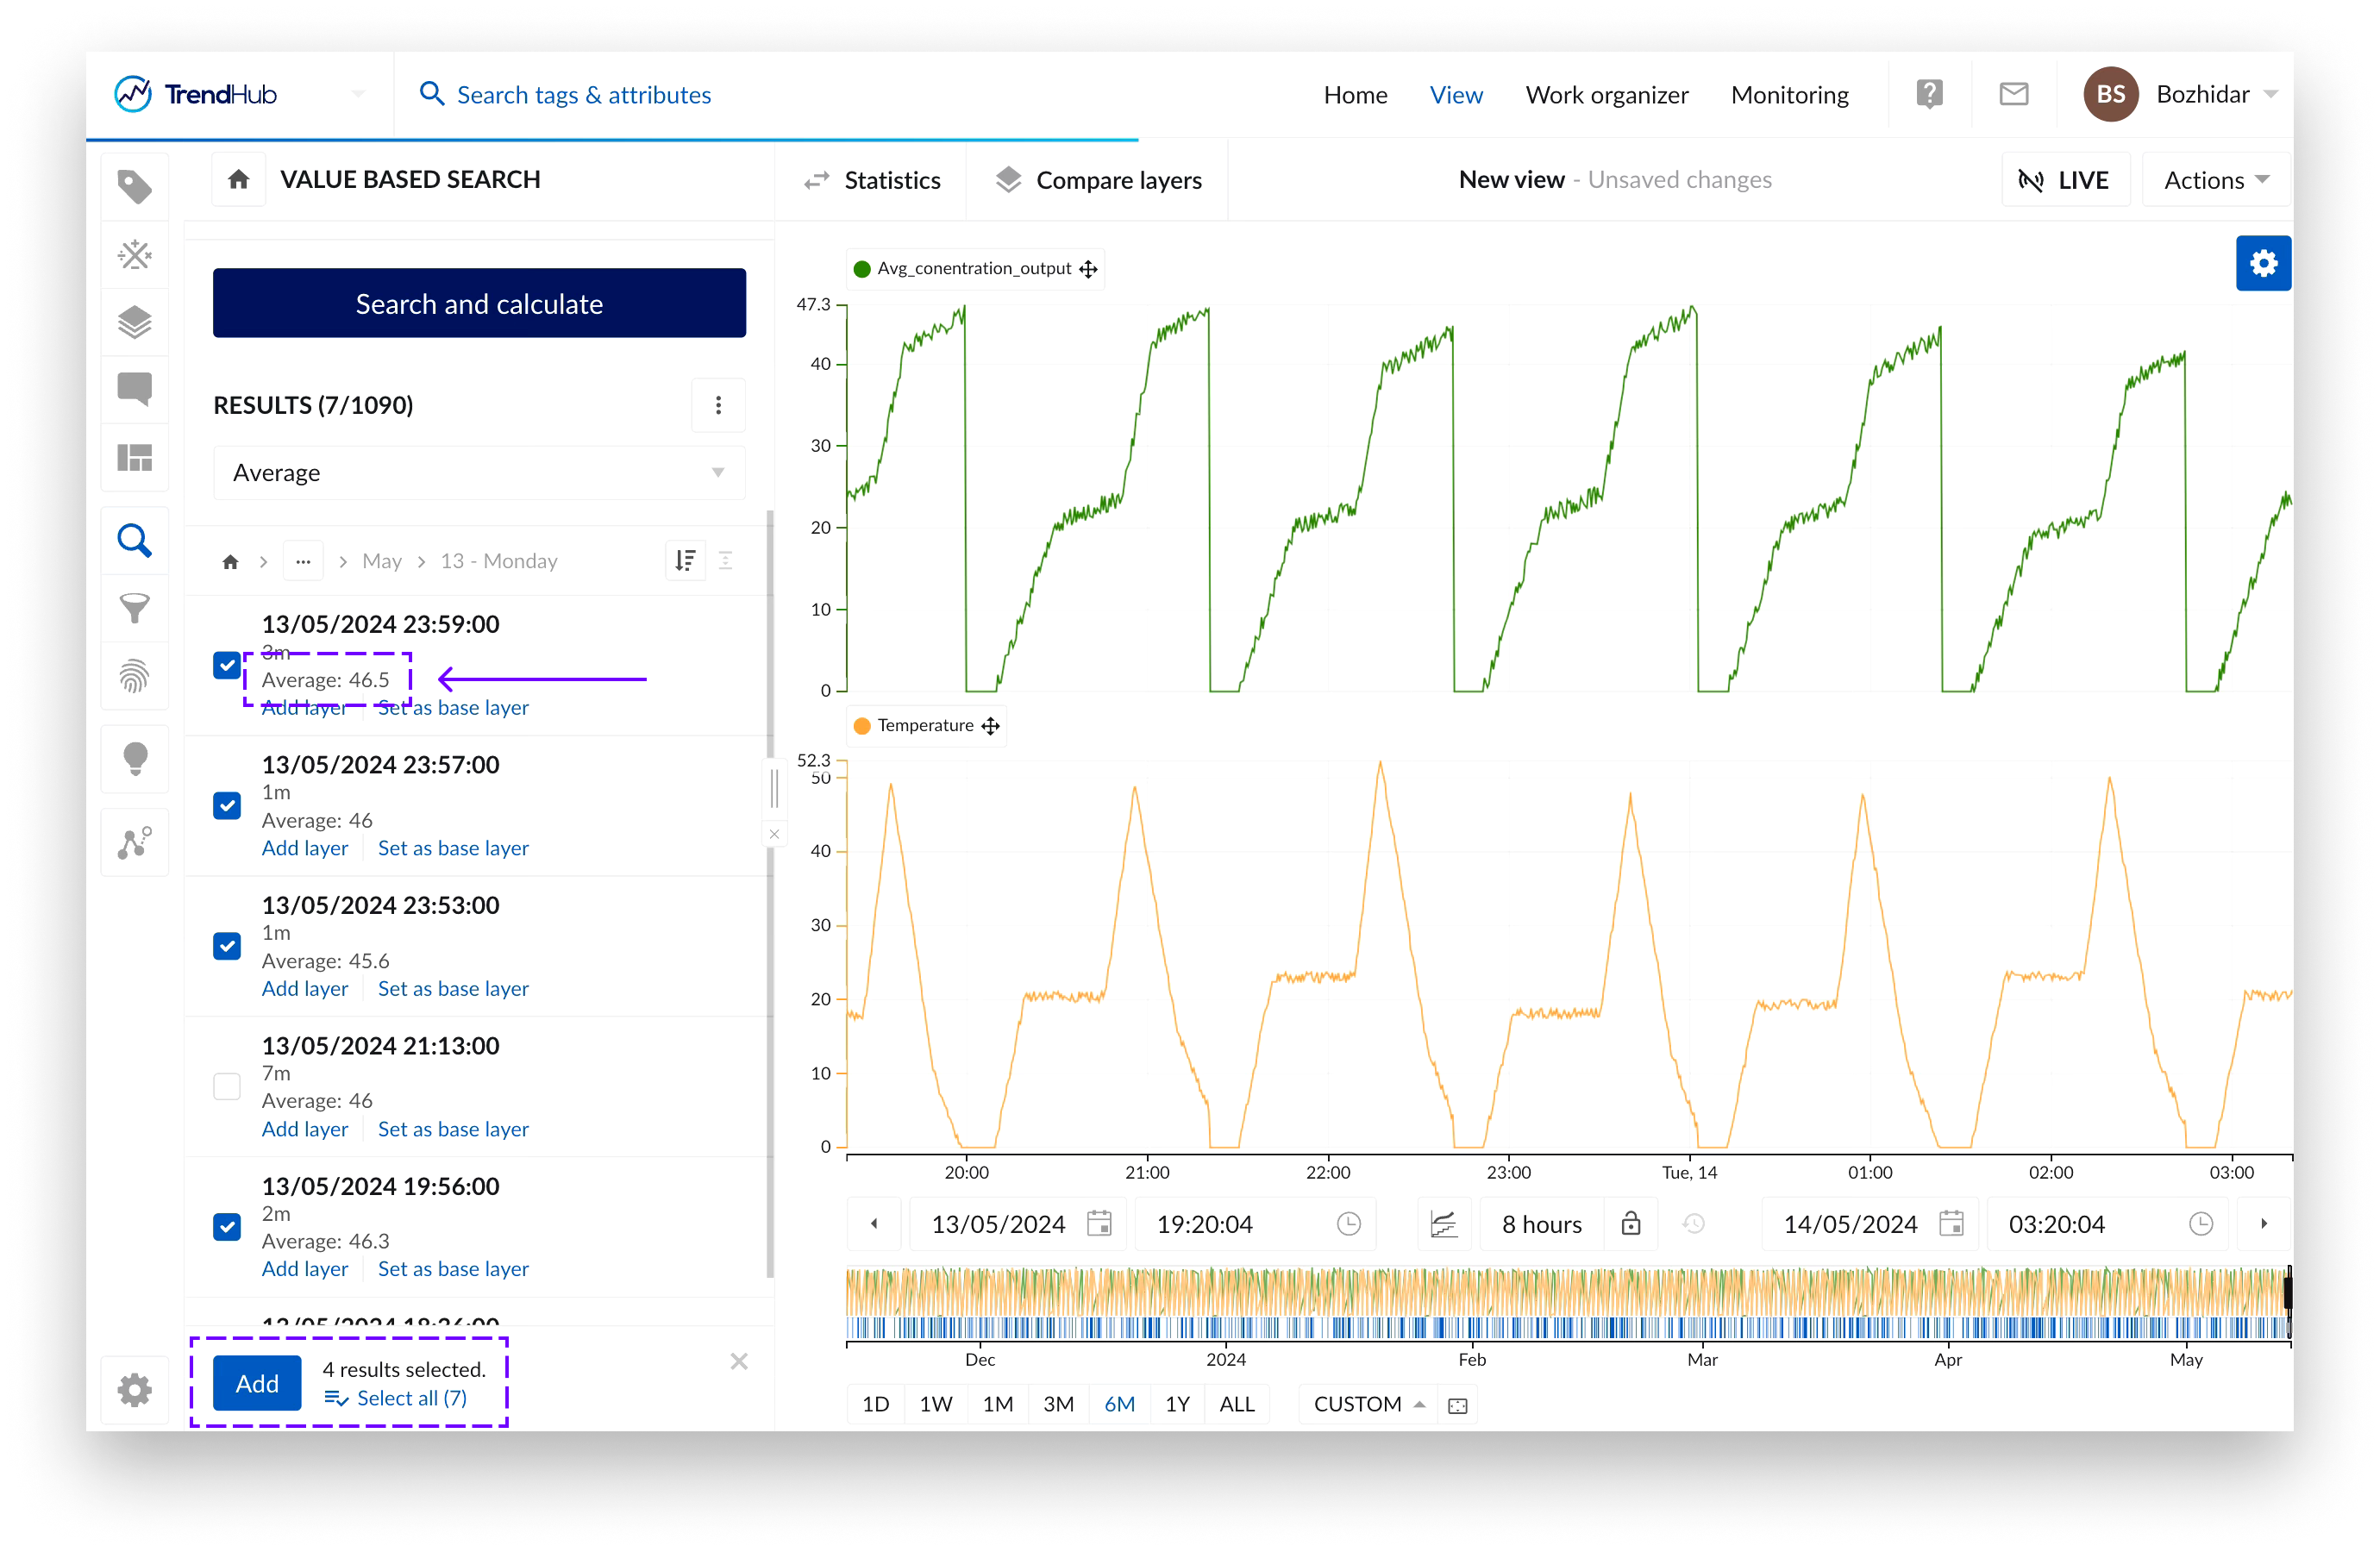
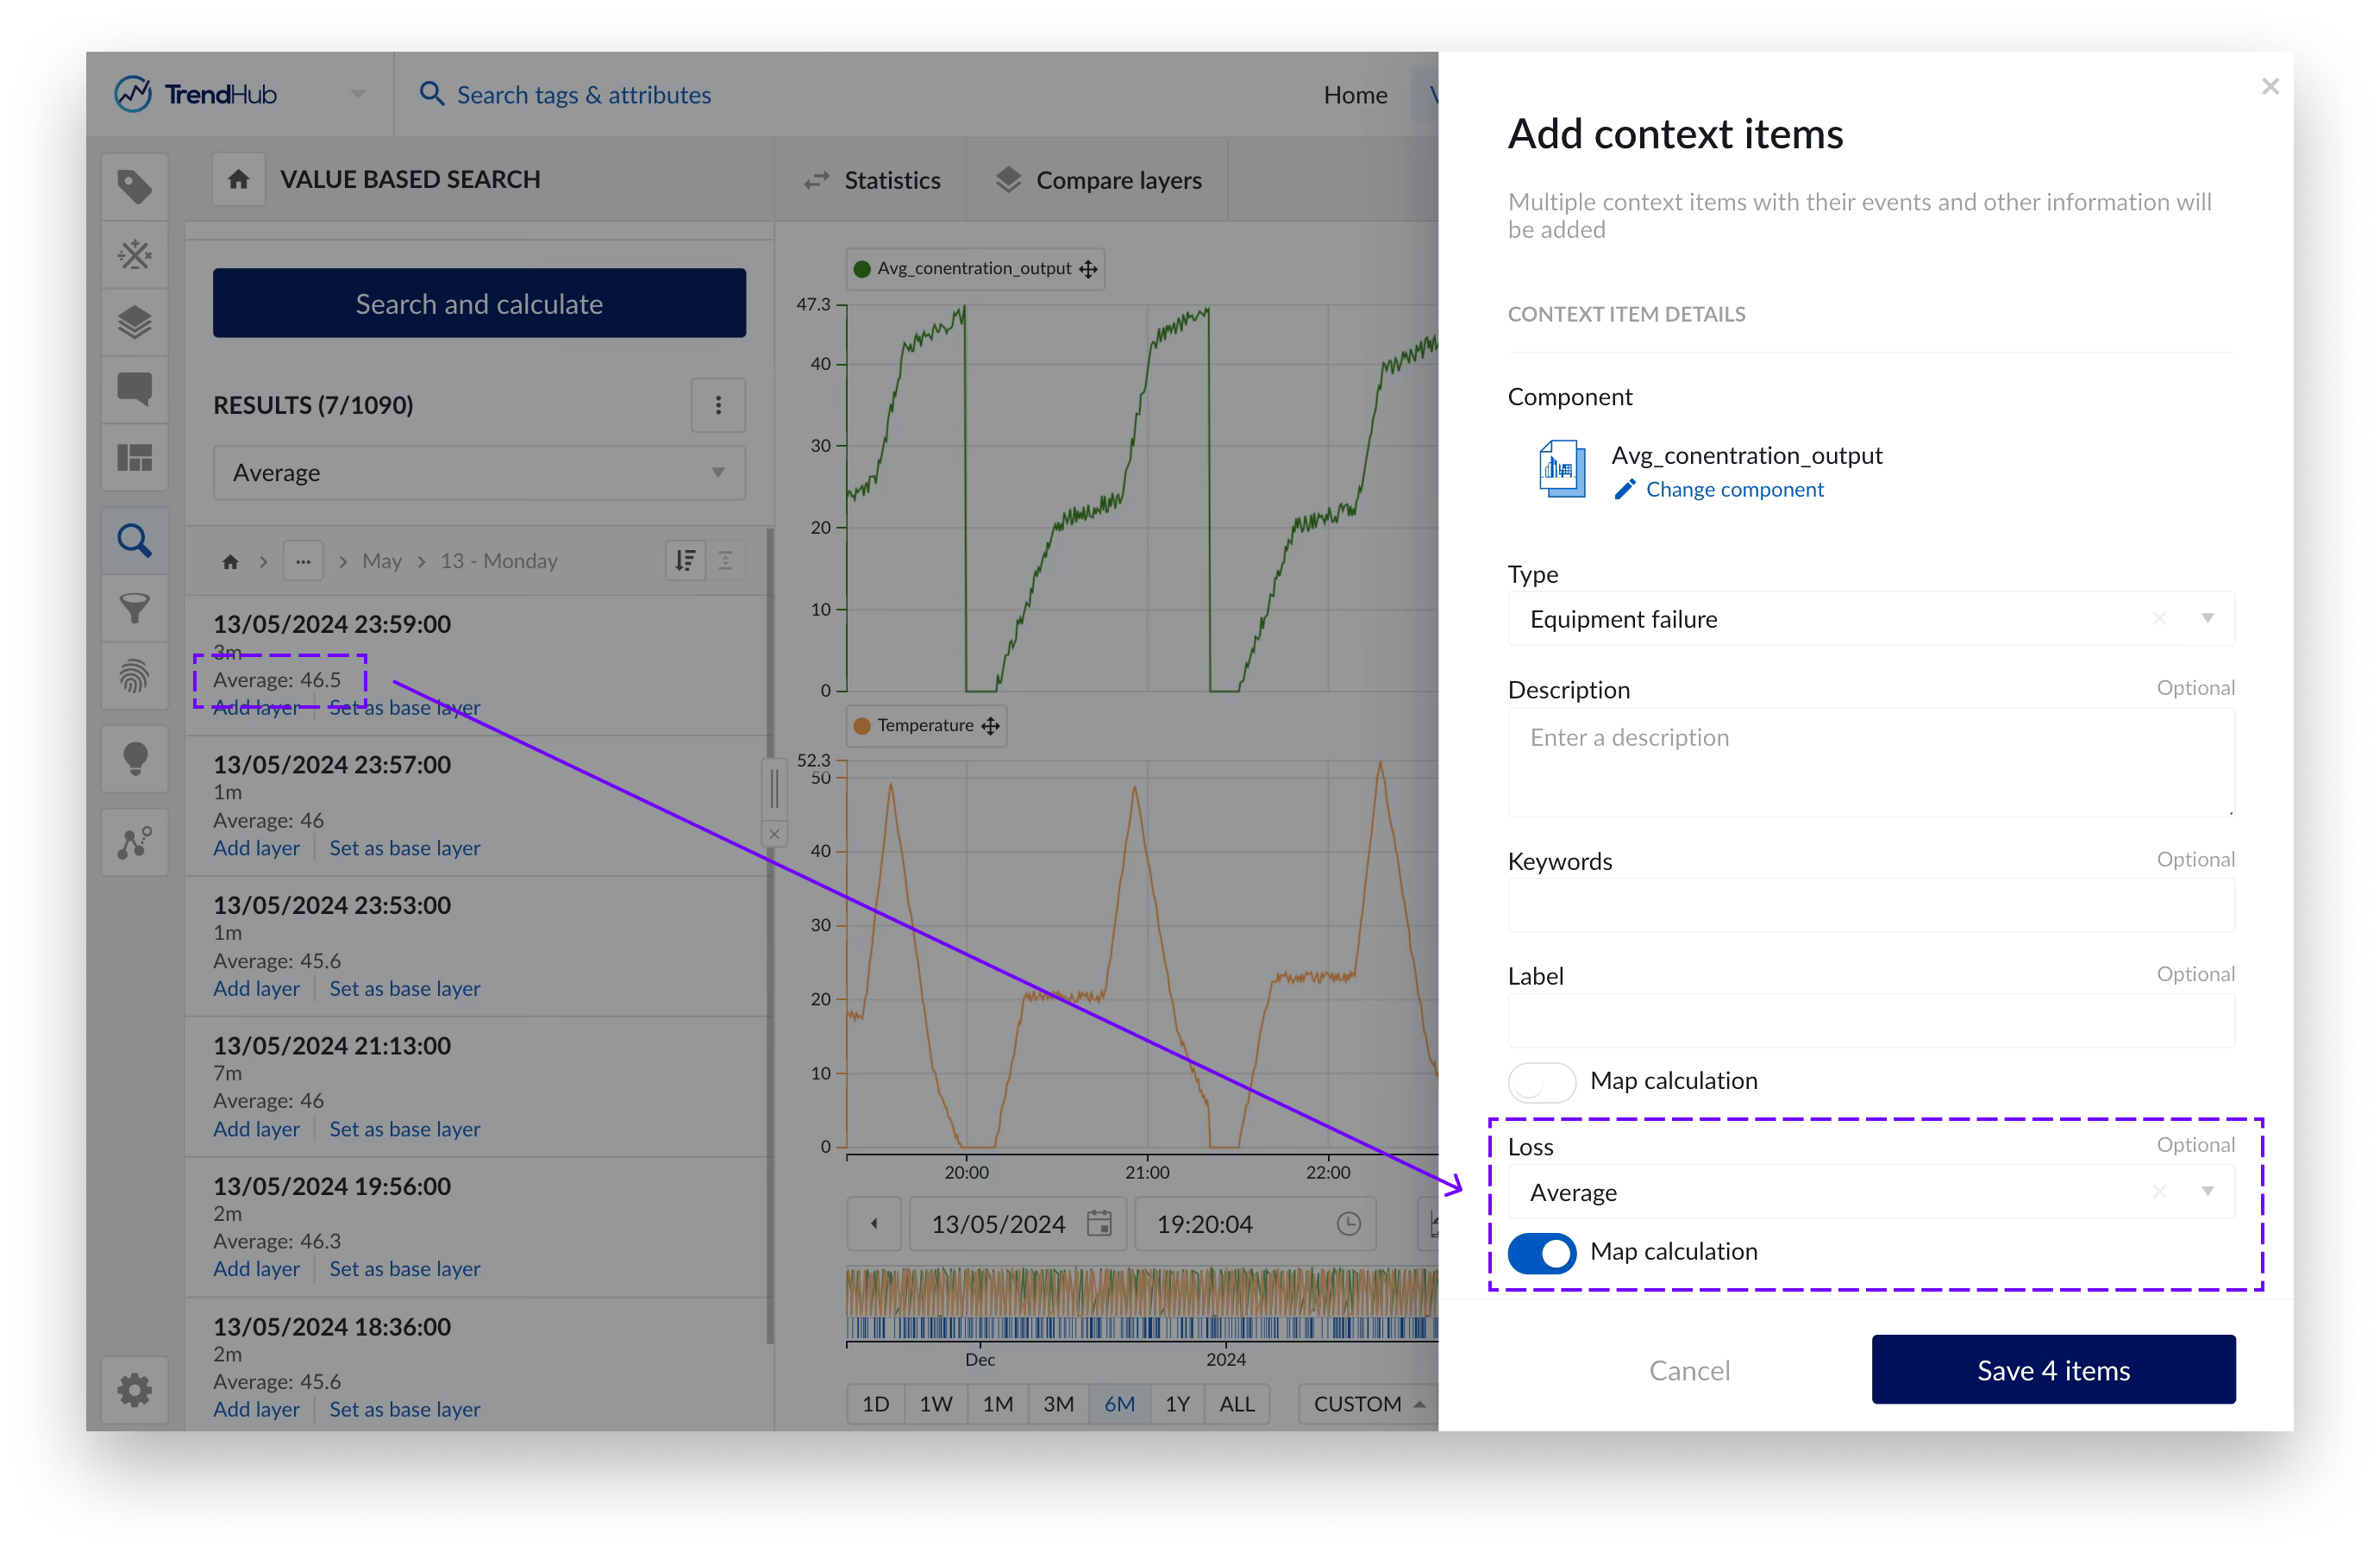
Once the selection is confirmed a configuration panel will appear on the right, where the desired component, type and field values can be configured.
If there are any configured calculations on the search results - their values can be saved in a field by using the “Map calculation” toggle bellow the chosen field. A drop down with available compatible calculations will be displayed instead of an input field, when the toggle is enabled.
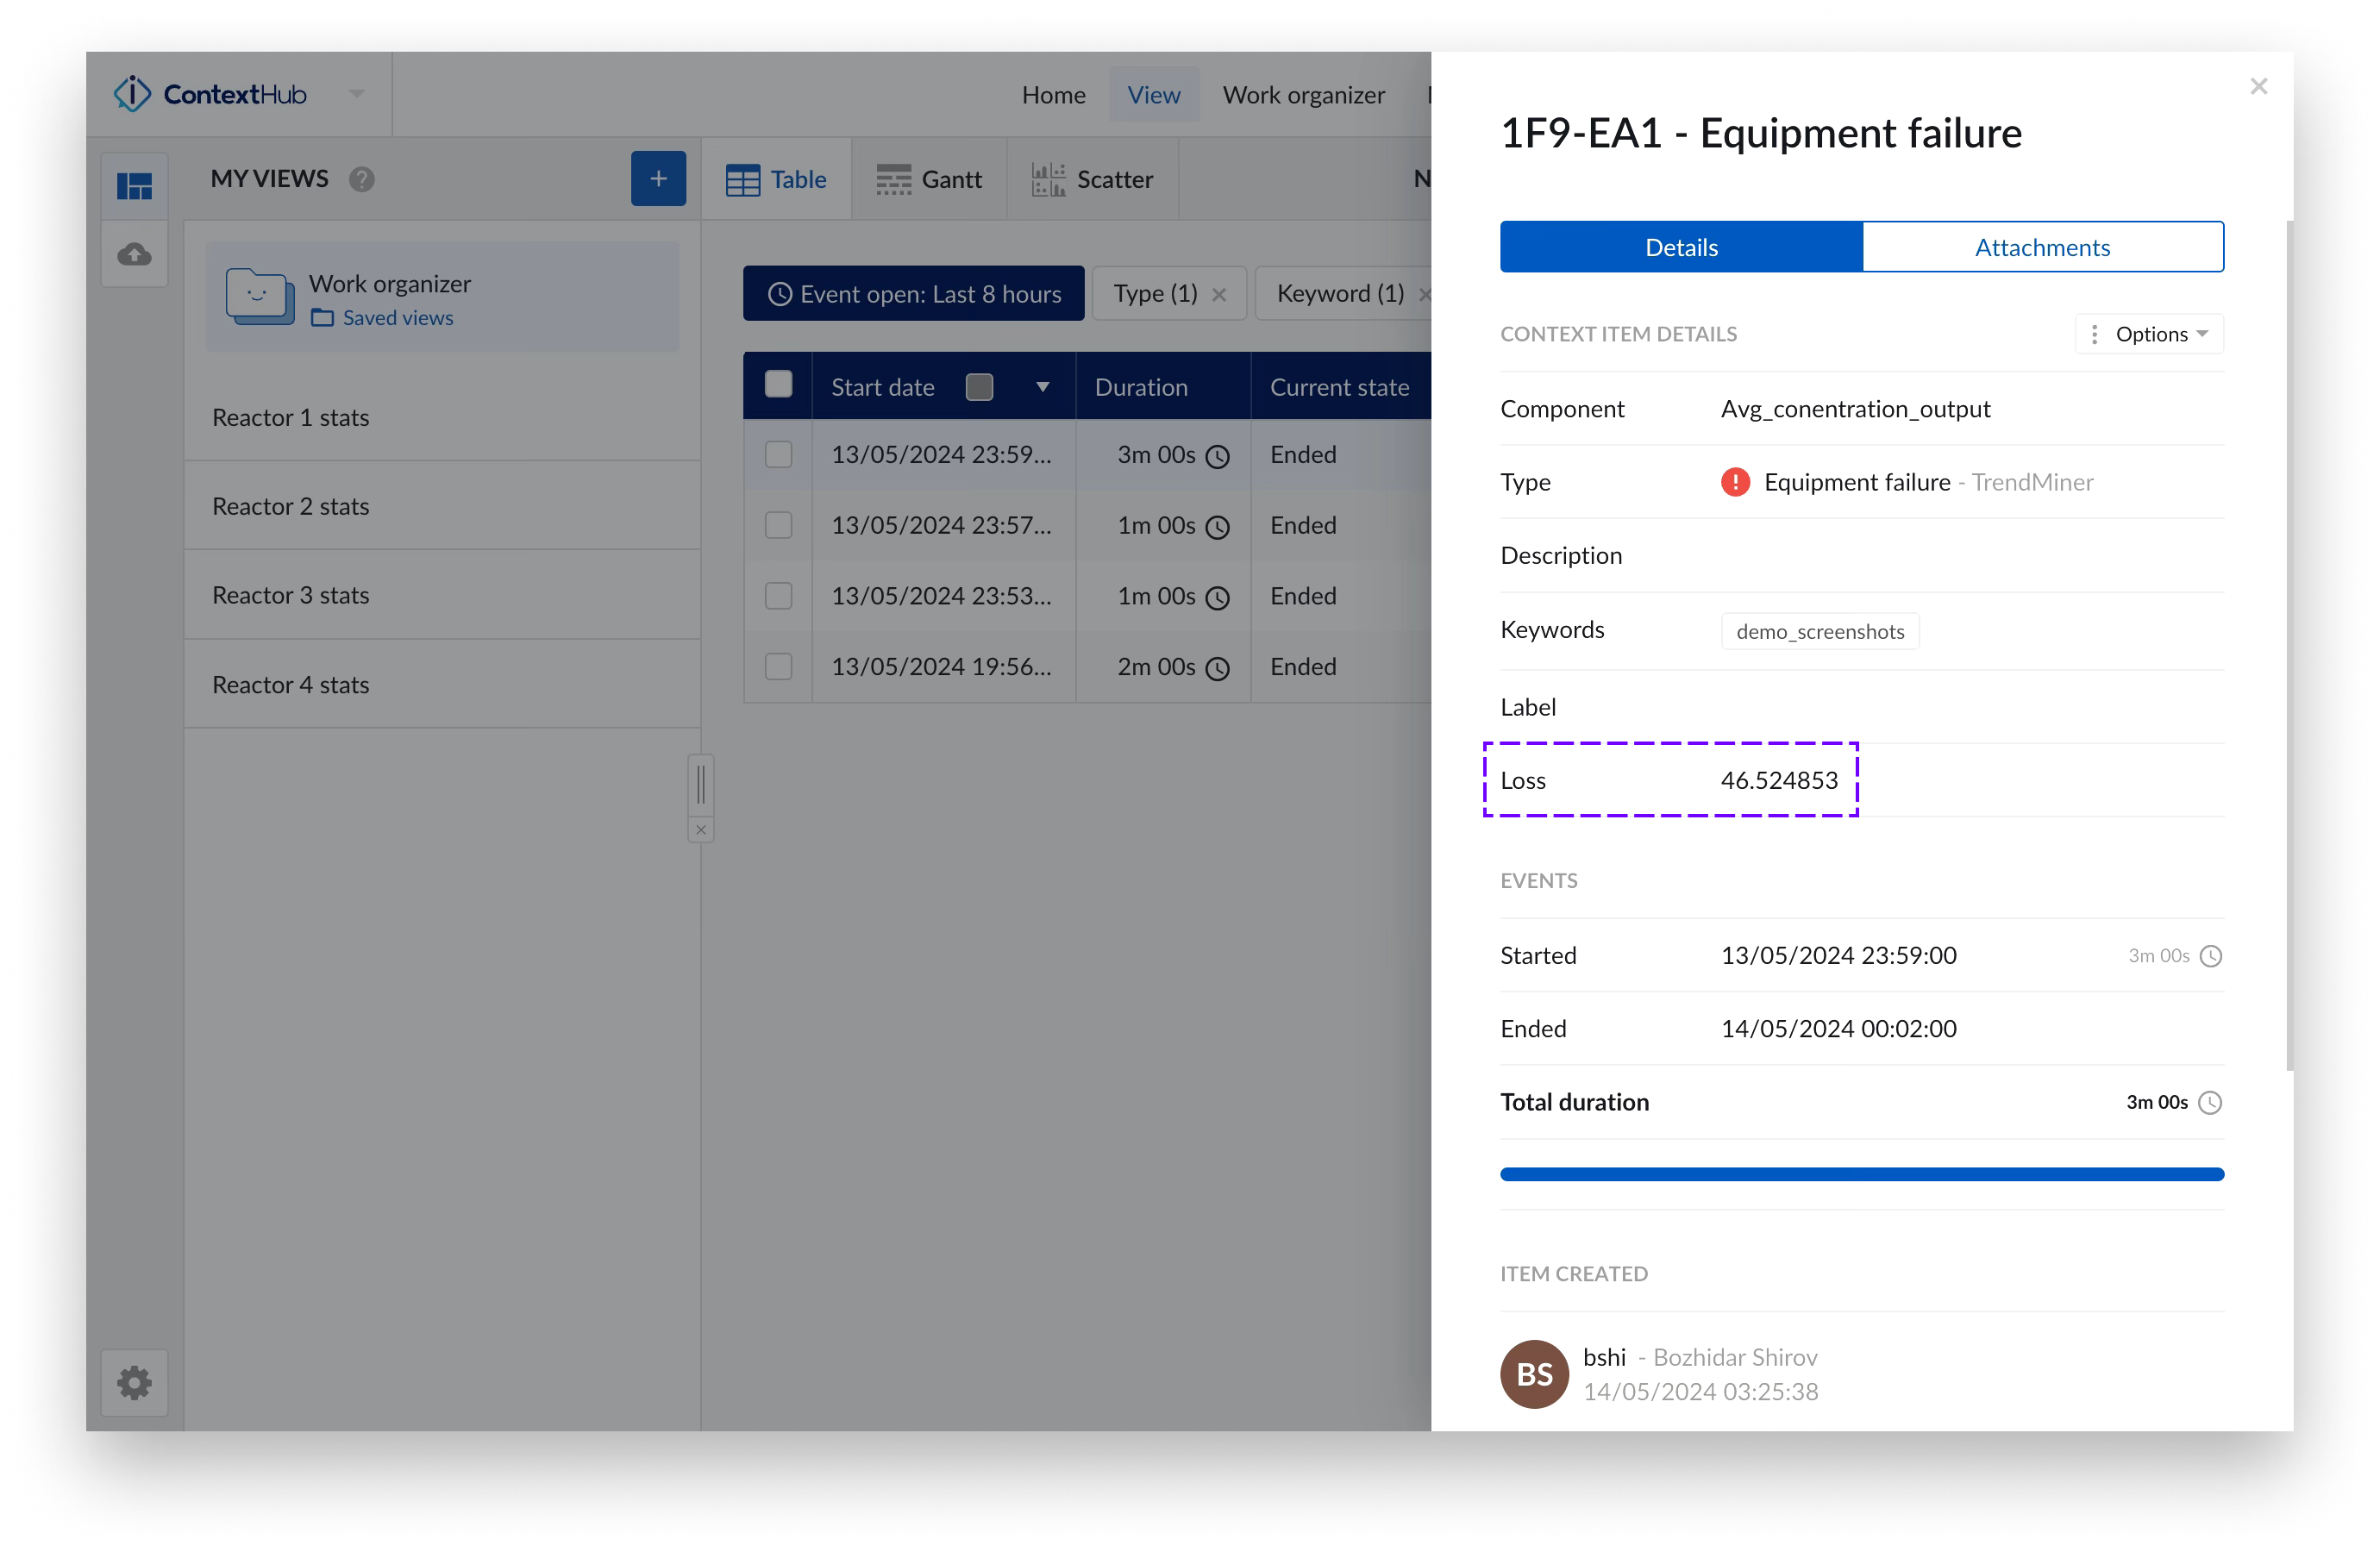
After the creation is confirmed, the items can be viewed in ContextHub:
If mapped, values from calculations performed on search results are present and can be viewed by expanding the context item details of an item of interest.
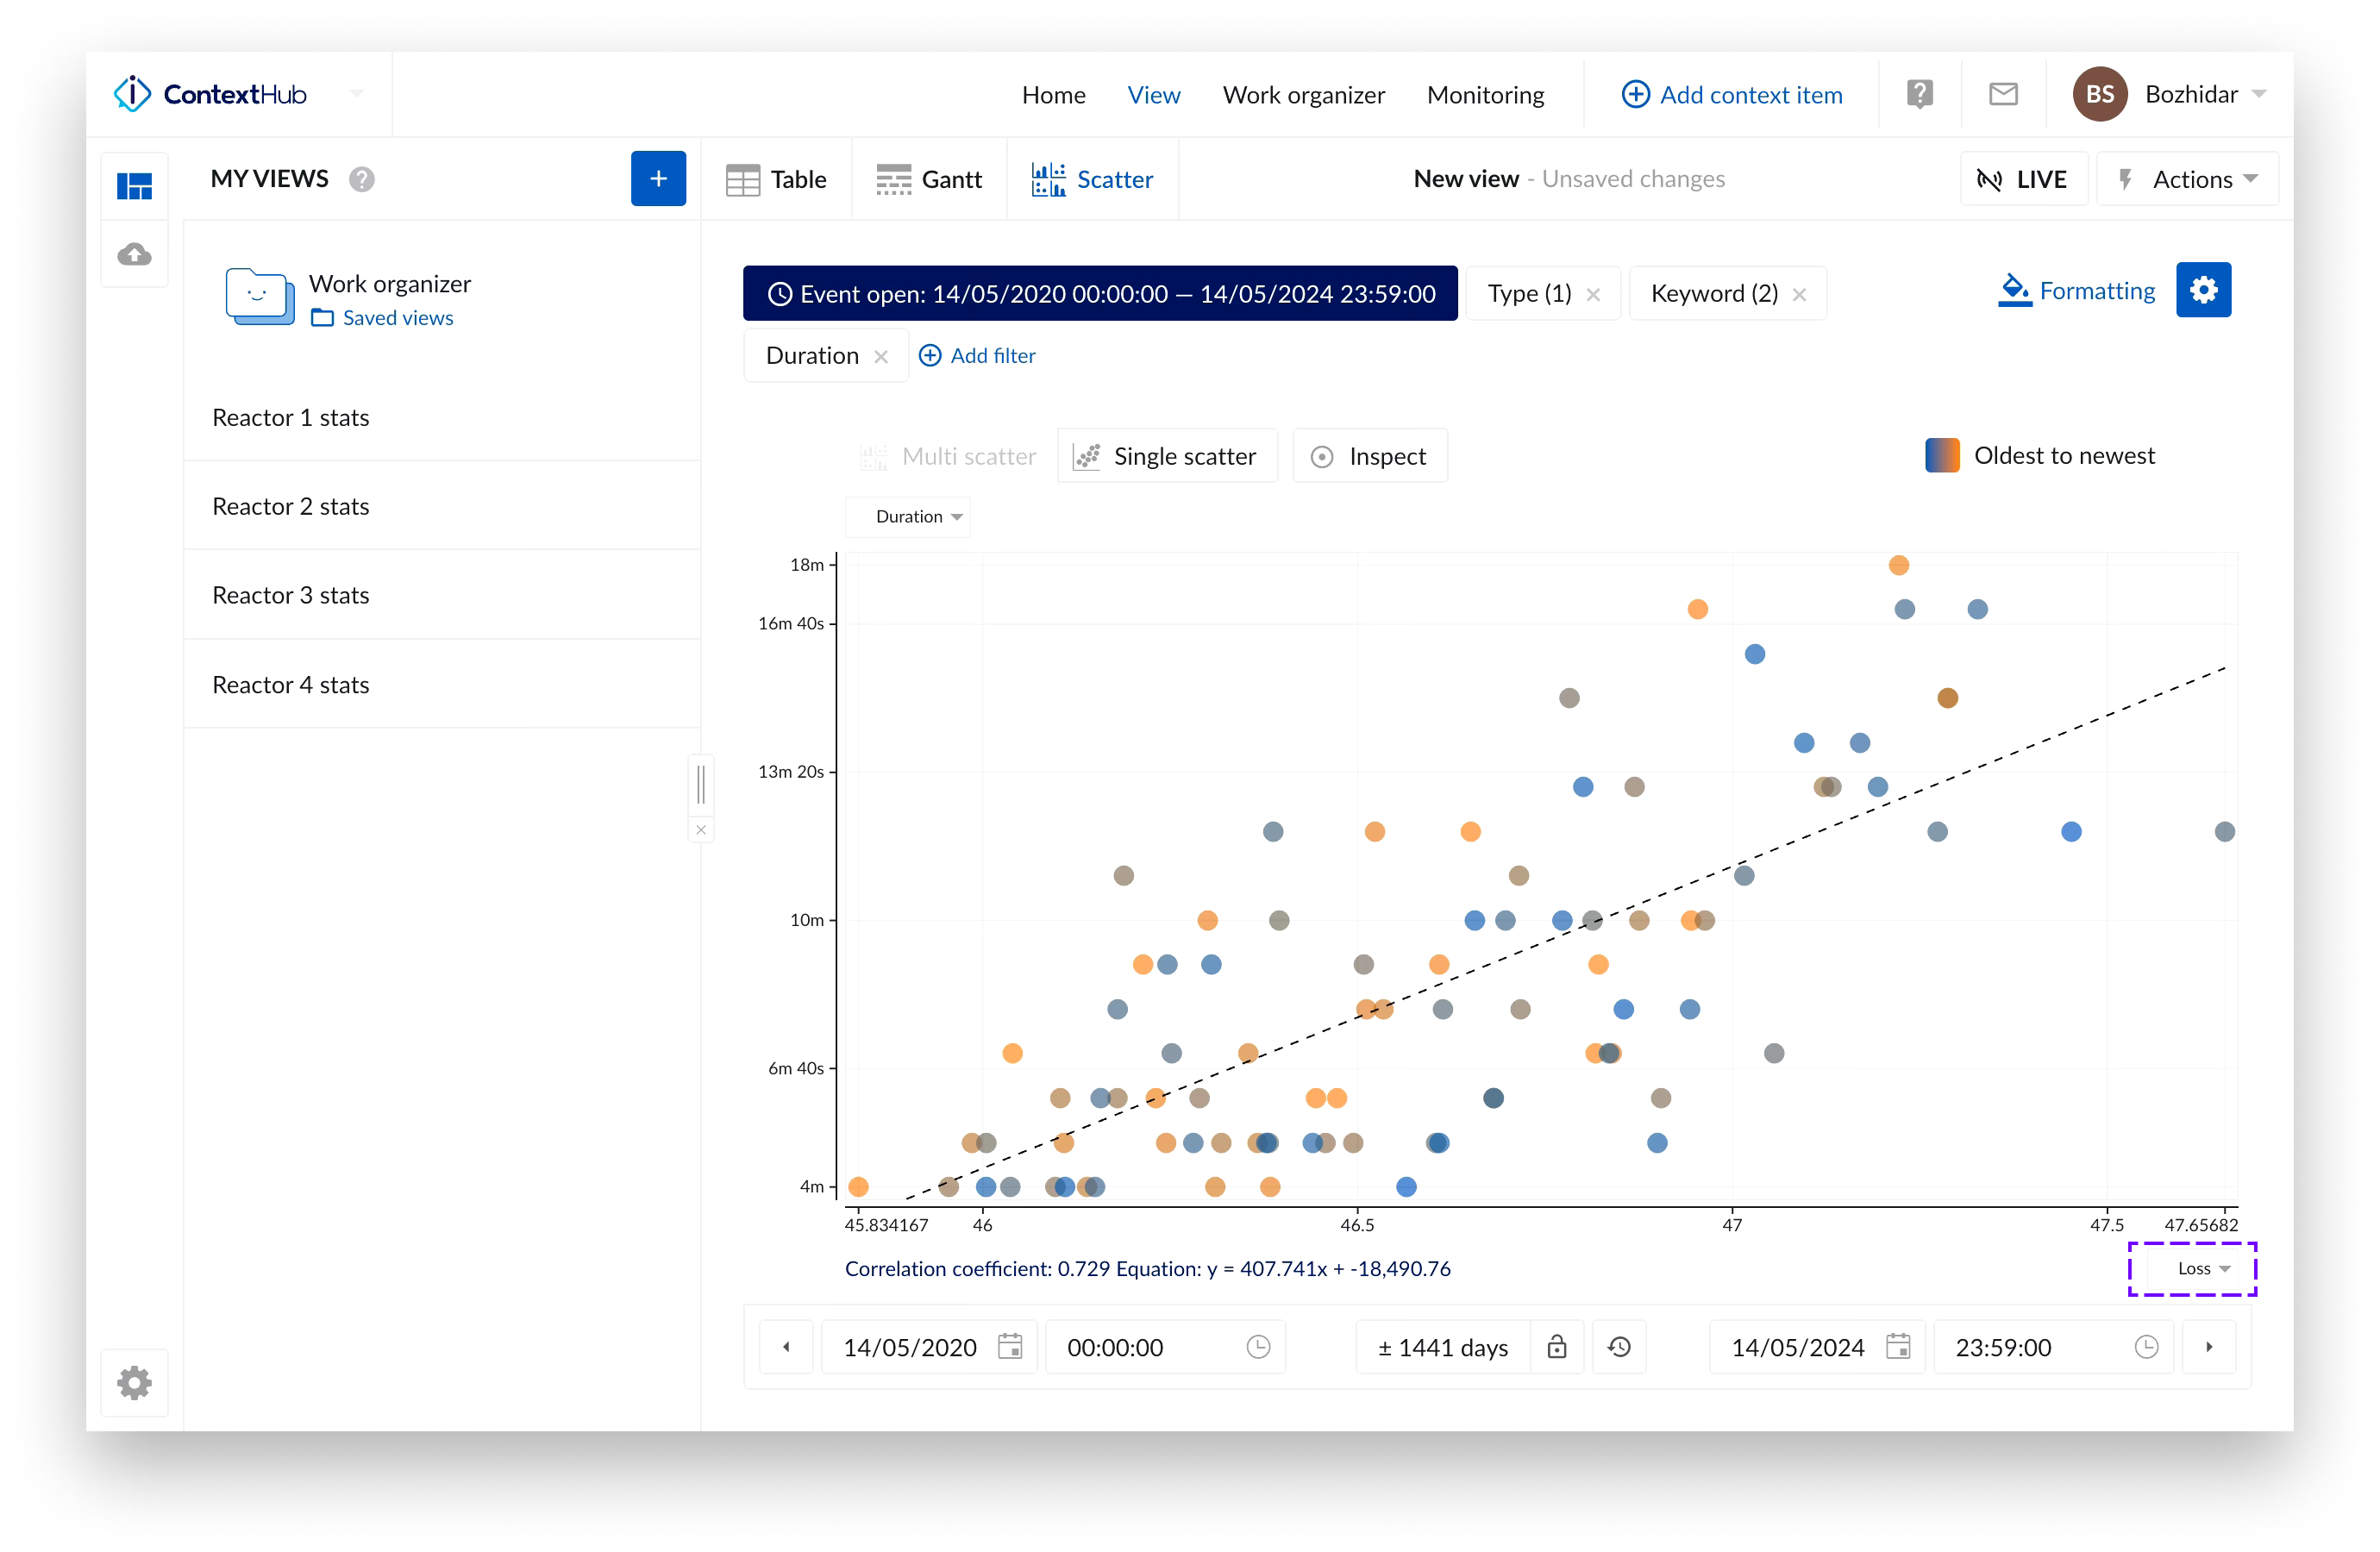
By taking advantage of the different visualization options and tools in ContextHub, additional analyses can be performed on the created context items. including saved values from calculation performed on search results.
Export
As the final option, you can also export all search results into an Excel file.
All of these actions use an analogous way of working. Once an action is selected, you can start selecting the desired search results for the action that you have selected.
At any moment you can see how many search results are selected and can easily select all search results in the current bin in one click. This is done by clicking the "Select all (...)" option in the footer on the right of the confirm button.
Note
The "Clear selection" option appears once all search results are selected.
Once the desired search results are selected, clicking the blue confirm button will execute the action you have selected.
For the keep/exclude result options you will notice that the filters are being created and added to the unsaved filters section.
For the context item option, a side panel will appear to perform a bulk creation of context items. To complete this option, the side panel needs to be completed and confirmed. The bulk creation of all context items is then triggered.
Note
A notification message will be added to the notification center once the bulk action is completed.
Note
Additional information about the context item creation can be found in this article.
For the export action, a message is displayed to indicate the creation of the export has started. Once the creation of the file is completed a notification center message will be shown. Clicking on this notification will download the export file.
Note
The search export download stays available for 7 days since the last download before it expires.
Note
Additional information about the format of the search result export can be found in this article.
Event analytics is also mentioned as an available action in the search result options. It does, however, follow a completely different flow as the previously mentioned actions.
Event analytics allows you to analyze search results based on aggregated values of each search result. The duration, or score (in case of a similarity search) of each result is combined with the defined calculations on top of the search results and can be presented using different visualizations. Next to the ad-hoc analysis on an event level, the event analytics pane can also be used to further refine your search results.
All previously mentioned actions can then be performed on the refined search result list.
Event analytics is explained in detail in this article.