MCP Connection
Note
The TrendMiner Agent requires a license and must be assigned to your user account before you can use it.
We want to bring the TrendMiner AI capabilities where our users connect with AI, so there are two ways to do that.
Open ecosystem: connect to TrendMiner from inside your own AI environment. Chat with TrendMiner through the AI chat applications your organization already provides, such as Microsoft Copilot, Claude, or ChatGPT, or a custom agent. The MCP connection covered on this page lets any of these platforms interact with your TrendMiner data, insights, and analytics tools.
Native experience: the TrendMiner Agent, embedded directly in TrendMiner, in the browser where you already work. See the “TrendMiner Agent” guide.
It’s the same TrendMiner data and the same analytics tools underneath. Your team just asks in whichever assistant they already use, and gets the same answer, based on your data, within your existing access controls.
Connect to TrendMiner MCP
TrendMiner’s MCP Server connects your process data and analytics tools to the AI assistant your team already uses, such as Microsoft Copilot, OpenAI ChatGPT, or Anthropic Claude.
Model Context Protocol (MCP) is a standard adopted by all major AI platforms. The TrendMiner MCP Server acts as a translation layer: it describes which tools, data, and actions are available, so any MCP-compatible AI assistant can use them.
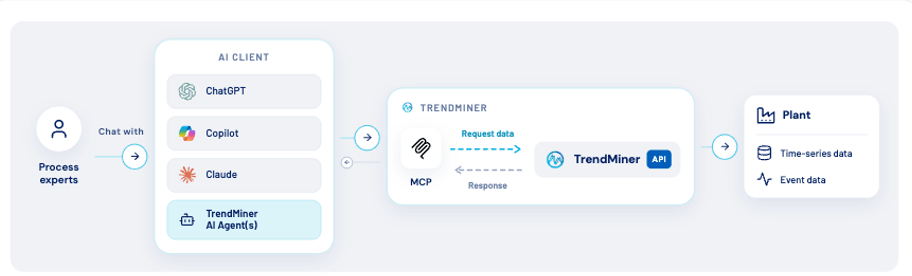
As a process engineer or operator, you can ask questions in plain language and get answers based on TrendMiner’s time-series data and purpose-built analytics tools.
Available tools
As part of the Early-Access Program, TrendMiner provides a catalog of analytics tools your AI assistant can use, grouped into Discovery, Data & Analysis, Visualisation, Events & Context, Monitors, and TrendMiner Help.
Discovery: search_tags, search_assets, navigate_asset_hierarchy, get_tag_profile. These tools let your AI assistant find the right tags and assets, understand the asset hierarchy and structure, and retrieve tag details such as type, measurement unit, and the range for which data is available. This context helps the assistant give you a more accurate answer.
Data & Analysis: get_tag_data, value_based_search, add_calculations, deep_dataset_analysis. These tools work with the time-series data behind your tags: run a value-based search for events that meet specific criteria, fetch raw tag data, calculate aggregations, and run deeper analyses, in a consistent and understandable way.
Visualisation: get_trendhub_session_url. This tool shows the result directly in TrendMiner, loading the right tags and setting the time range, so you can verify it yourself. This human-in-the-loop validation is an important safety net.
Events & Context: search_context_types, search_context_items. These tools let your AI assistant discover the context types configured in your instance, such as maintenance orders, incidents, or batch records, and search recorded operational events linked to your tags and assets within a time window.
Monitors: list_monitor_results, get_monitor_detail. These tools let your AI assistant see which monitors have been firing and how often, and inspect what a specific value-based monitor is searching for.
TrendMiner Help: lookup_trendminer_knowledge. This tool gives your AI assistant TrendMiner’s own product knowledge, so it can explain how to use a feature or walk you through a task, such as building a formula or configuring a monitor.
Note
The catalog will keep growing with each release, moving toward full TrendMiner Agent capabilities.
What you can ask
The examples below are starting points, not fixed recipes. Adapt them to your own tags, assets, and terminology.
Discovery
Tool | Example prompt |
|---|---|
search_tags | “Which tags measure vibration on the pumps?” |
search_assets | “Which reactors do we have on the batch line?” |
navigate_asset_hierarchy | “Show me the asset hierarchy for reactor R-101.” |
get_tag_profile | “What’s the unit and normal range for the dryer outlet temperature tag?” |
Data & Analysis
Tool | Example prompt |
|---|---|
get_tag_data | “Get me the raw data for the dryer outlet temperature over the last 24 hours.” |
value_based_search | “Find all periods last month where the reactor temperature exceeded 180°C.” |
add_calculations | “Add a 24-hour rolling average calculation to this tag.” |
deep_dataset_analysis | “Has a deviation like this happened before on this asset?” |
Visualisation
Tool | Example prompt |
|---|---|
get_trendhub_session_url | “Show me that in TrendHub so I can check it myself.” |
Events & Context
Tool | Example prompt |
|---|---|
search_context_types | “What context types are set up in TrendMiner, like maintenance or incidents?” |
search_context_items | “How many maintenance events did we have in 2026, and on which equipment?” |
Monitors
Tool | Example prompt |
|---|---|
list_monitor_results | “Which monitors have fired the most in the last month?” |
get_monitor_detail | “What is this monitor actually watching for?” |
TrendMiner Help
Tool | Example prompt |
|---|---|
lookup_trendminer_knowledge | “How do I build a formula tag that flags when a signal is rising or falling?” |
Example use cases
For example, take the reporting case. Every morning, someone on your team reviews the overnight events, alarms, and deviations, and writes up the findings before shift handover, typically an hour of work, every day, rebuilding the same report. Now, you can ask your AI assistant to write it, and it comes back as a ready-to-use report based on the latest process data.
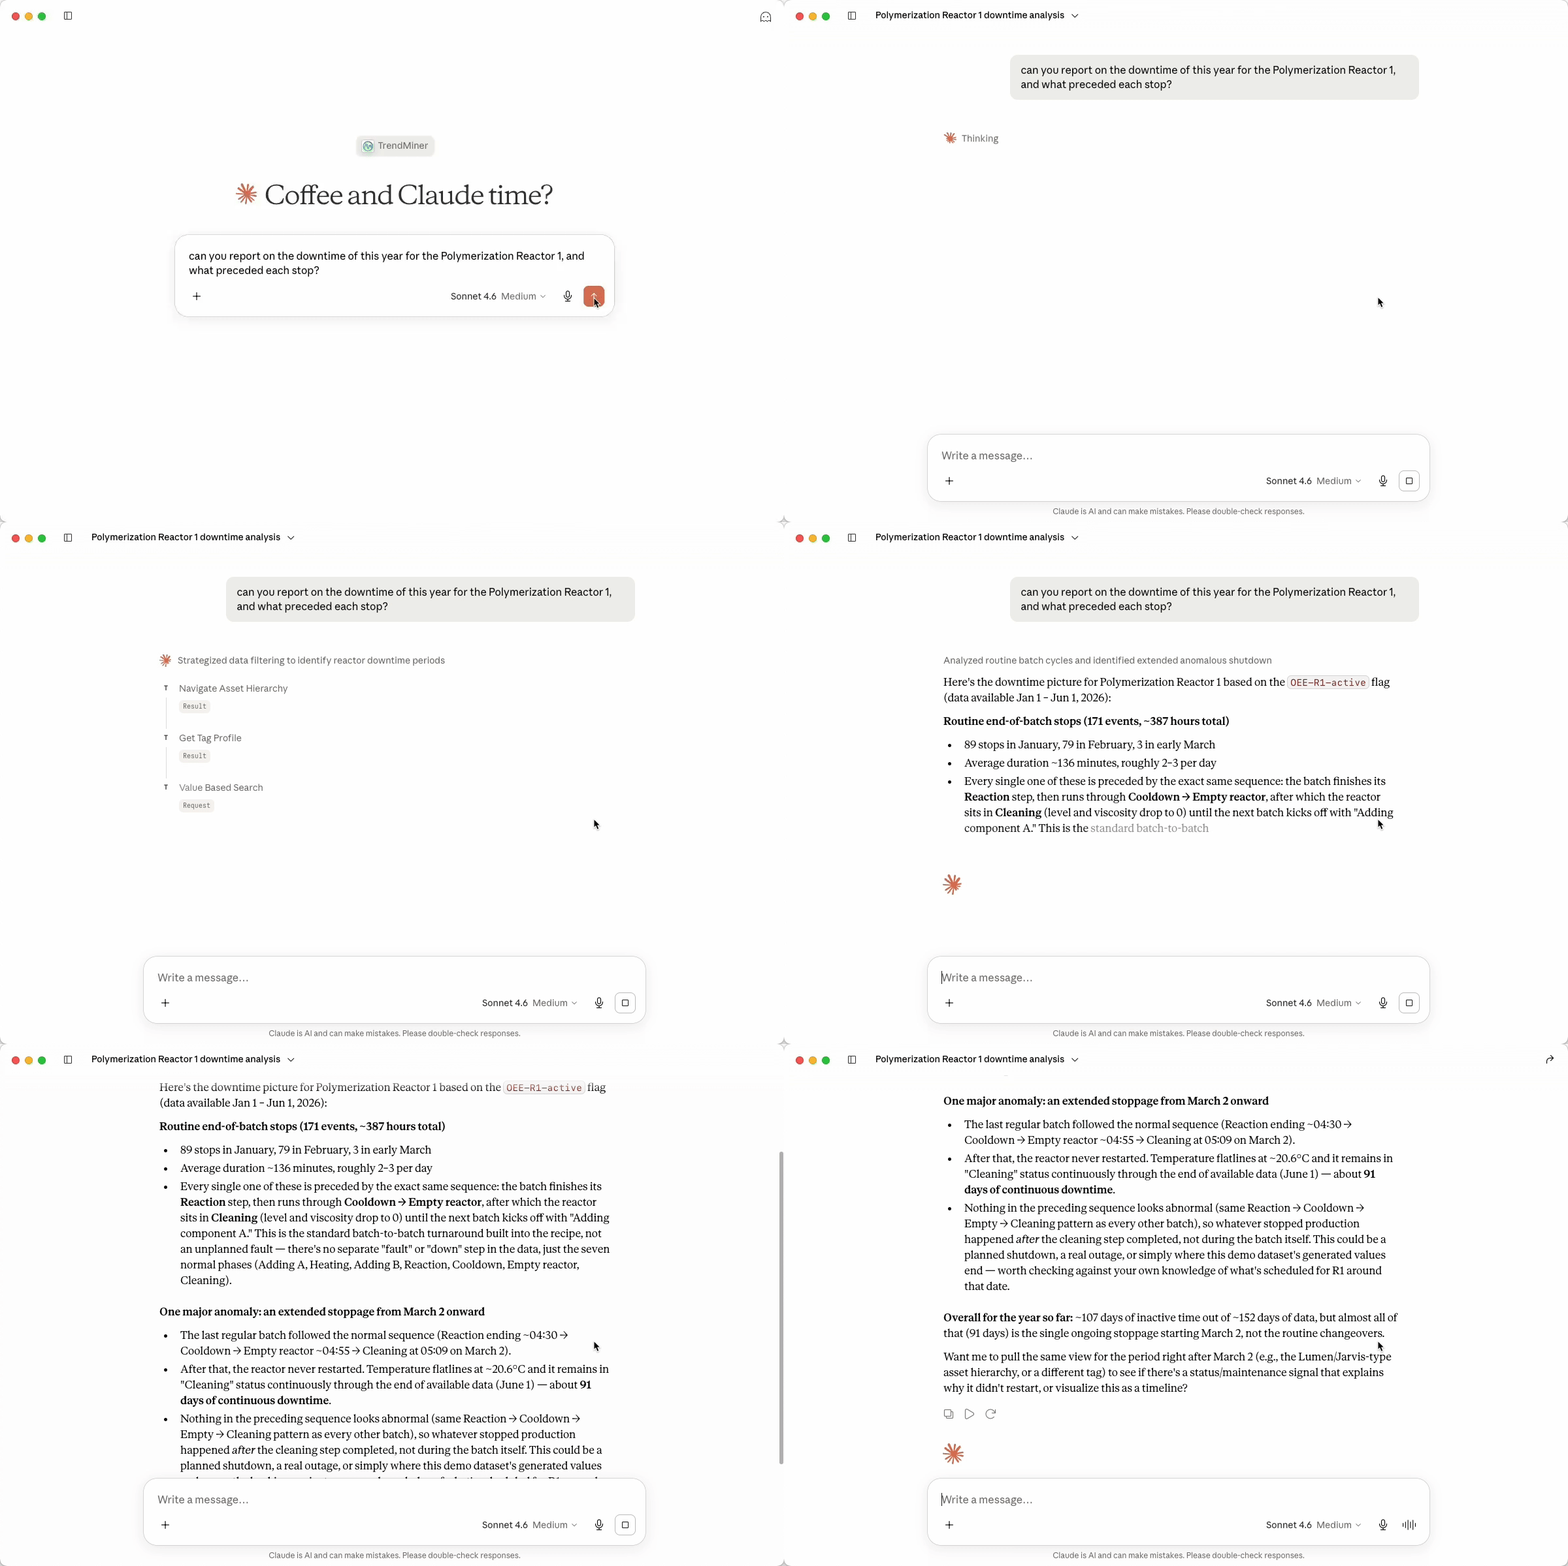
With these MCP tools, questions your team already works on every day become things you can simply ask your AI assistant.
Downtime and availability: report downtime events for an asset over a period, count, duration, average, and trend by month. Correlate downtime with preceding conditions. Compare availability across similar assets or production lines.
Root-cause analysis: investigate what led up to a quality deviation, alarm, or shutdown. Find similar historical events or patterns. Identify which tags deviated first in a cascading failure.
Batch and quality: compare batch performance against a golden batch or spec limits. Flag batches with abnormal duration, yield, or deviations. Summarize quality trends per product or recipe.
Reporting and summarization: overnight events, alarms, deviations, and KPIs, ready for shift handover. Weekly or monthly performance recaps per asset or plant area.
Monitoring and Alerting: explain why a current alarm or KPI is out of range using recent tag history. Summarize the operational state of an asset.
Process optimization: correlate process parameters with yield or energy consumption. Spot recurring inefficiencies, such as excessive cleaning cycles or frequent restarts.