Indexing explained
TrendMiner uses a caching mechanism (referred to as indexing) to allow fast, interactive visualization and analysis of your time series data. Indexing is used in all algorithms: search, diagnose, monitor, and predict.
Whenever a tag is accessed by a user for the first time on a TrendMiner setup (typically by adding the tag to the active tag list), the tag will go through an indexation process. Once a tag has been fully indexed, this index is available for all users within the TrendMiner installation (taking into account data access permissions).
TrendMiner ensures indexes are kept up to date by appending data to the index at regular intervals, without requiring any interaction from you. This enables fast access to recent data for analysis.
There are two important, configurable parameters related to indexing:
Index resolution: determines how granular your analysis will be.
Index horizon: determines the earliest date from which indexes are created.
By default, the index resolution is set to 1 minute. The default index horizon depends on when TrendMiner was installed:
Installations from 2026.R1 onwards: January 1st of three years before the installation year (e.g., January 1, 2023 for installations in 2026)
Earlier installations: January 1st, 2015 (or January 1st, 2010 for installations before 2019.R2)
Both parameters can be modified by the TrendMiner administrator in ConfigHub
Note
As administrator of TrendMiner, you can access the index overview page to get an overview of all indexed tags and their current state.
How indexing works
The pictures below provide a conceptual explanation of the indexing process for an analog tag, and how the resolution setting impacts the created index.
In the first image, the original data as stored in the database is visualized for a period of 1 minute. Every blue dot represents a value of the time series stored in the database (this might already be compressed, based on the storage settings of the database).
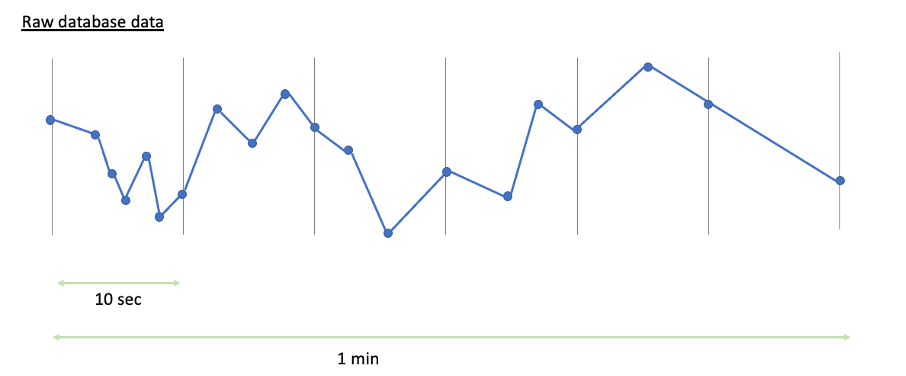
The configured index resolution defines how many data points TrendMiner receives from the database. For a resolution of 10 seconds, TrendMiner requests data at 10-second intervals. TrendMiner's historian connectors ensure you get the most significant data for these intervals. For an Aveva PI connector, this means you potentially receive 4 data points per interval (the start value, end value, maximum value, and minimum value within the interval).
The red dots in the images below indicate which data would eventually be available in TrendMiner's index for a 10 second resolution setup (top) and a 1 minute resolution setup (bottom).
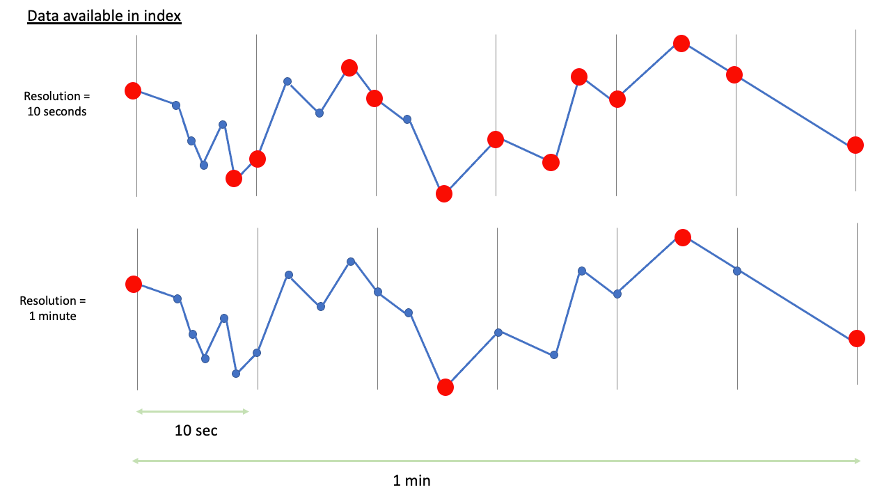
Both the performance of the underlying databases and the configured index resolution influence the speed of indexing. Higher index resolution means the database transfers more data points, so the indexing process takes longer. Defining a resolution is therefore a trade-off between data granularity and performance.
Indexing direction and priority
Initial indexing always starts from the current time and progresses back to the configured horizon (this is called backwards indexing). When many tags are indexing simultaneously, most recent data always gets priority. This ensures users can start their analysis on recent data immediately.
As a user, you can follow up the indexing process by checking the index state in the tag details of the active tag list, or by looking at the context bar (which is plotted purely from indexed data).
Once tags are backwards indexed, TrendMiner keeps these indexes up to date (forward indexing) by appending data at regular intervals, without requiring interaction from you.
Note
As an administrator, you can access the Index Manager to get an overview of all indexed tags and their current state.
The index allows fast, interactive analysis of your data and is used in all algorithms.
For trend charting (the focus chart), index data is used to facilitate fast visualization of long time periods—specifically, whenever the visualized period is larger than 300 times the index resolution (5 hours for an index resolution of 1 minute).
For shorter periods, the index data might be too coarse, so data is requested directly from the database to ensure the most accurate representation. Data is also requested directly from the historian when indexed data is not (yet) available.
Searches are executed solely on indexed data.
The minimum duration of a search result depends on the index resolution and the search algorithm:
Value-based, digital step, and area searches: Minimum duration is 2 times the index resolution (2 minutes for a default 1-minute resolution). For periods shorter than this, TrendMiner cannot assess the search criteria. Search result durations are always multiples of the index resolution.
Similarity searches: The search query length must be at least 4 times the index resolution. Only indexed data is used to check for similarity, which enables fast analysis.
For very short periods, similarity search results might seem inaccurate. The search algorithm finds results where the index data corresponds with the index data of the query period. When plotting such short periods, TrendMiner retrieves data directly from the historian. For high-resolution tags, many more data points are visualized than were used in the search algorithm, which can explain observed deviations.
The fingerprint hull is generated solely from charted data, following the logic explained in the charting section. Fingerprint evaluation (in monitors and the fingerprint deviation diagnostic tool) uses the index data of the tags to be analysed.
The index of all calculated tags is built by performing calculations on top of the index of the underlying tags.
When charting these tags for periods smaller than 300 times the index resolution, tags are queried directly from the database and calculated tags are evaluated "on the fly."
The diagnose algorithms use indexed data to evaluate correlation and fingerprint deviations.
Similar to similarity searches, the cross-correlation analysis can yield high correlation numbers on very short time periods (approximately equal to the index resolution), although the visualized raw data may show no or only slight correlation.
Monitors are built on top of searches and allow you to operationalize your searches. Monitors therefore use the same data as searches.
To ensure monitor results are received in a timely manner, the index of tags used in monitors (including underlying tags in formulas) is updated every 2 minutes.
Working with data before the index horizon
When you work with time periods that start before the configured index horizon, TrendMiner displays warning indicators to alert you that some features may be affected.
Why this matters
Index data enables fast visualization and is required for certain features like similarity search. When the start of your selected time period is before the index horizon:
TrendMiner must fetch data directly from the historian instead of using the index, which is slower and causes additional queries to the historian, i.e. a performance impact affecting user experience.
Some features that require index data will not work correctly or at all.
You will see Warning icons (⚠️) next to date indicators throughout the application when the start and/or end date is before the horizon.
Impact by feature
The following table indicates how every feature is impacted when using data before the horizon. This is directly linked to the section above which describes how index data is being used. TrendMiner has no index data available for periods before the index horizon.
Feature | Impact when working with data before the horizon |
|---|---|
Trend views | Data is fetched from the historian instead of the index. Calculated tags also pull data directly from the source for the involved variables.1. This is slower and has a high performance impact but the chart displays correctly. |
Dashboards | Same impact as Trend views1 |
Searches | Searches can only yield results for periods within the index range |
Similarity search with a query before the index horizon | Does not work. Similarity search requires index data. Searches with a query period before the horizon will not return results, and related monitors are system-disabled. The same applies to monitors on a fingerprint using similarity search as a trigger. |
Fingerprints | Existing fingerprints - based on data before the horizon- continue working using their cached hull. However, if you update such a fingerprint, the hull is recalculated using the newly charted data fetched directly from the historian 1 —the shape may change significantly. |
Prediction tags | Existing prediction tags are in essence a saved formula and will therefore keep working. The analysis itself requires index data and hence can no longer be executed or evaluated |
1 This is the default behaviour for most datasources. However, some internal and external sources differ. Custom calculations and machine learning tags (which are internal TrendMiner tags), use only index data and never calculate values on the fly. For common external data sources, TrendMiner usually pulls directly from the data source if no indexed data exists. For data sources requiring custom queries, pulling directly from the data source can be disabled.
Resolving issues with affected items
Affected items can be fixed by re-extending the horizon. All affected items will/can be corrected once the index data is available again. Alternatively, each item should be reassessed to see if the same result can be achieved using data after the new horizon.
Contact your administrator to resolve an affected item by moving the index horizon.
For administrators
Before reducing the index horizon in ConfigHub, you can generate an Excel export listing all similarity searches and similarity search based monitors that will be affected. This helps you assess the impact and communicate with affected users before making the change.
After the horizon is reduced and index data is deleted, you will receive a notification confirming the deletion is complete.
See the ConfigHub Data settings documentation for details on changing the index horizon.