Gathering the number of events straight from focus chart rather than having to do a search
In data analysis, a common objective is to determine how often a particular event occurred on a daily basis. The concept here is to generate this number directly from the focus diagram, eliminating the need for a separate search and data export.
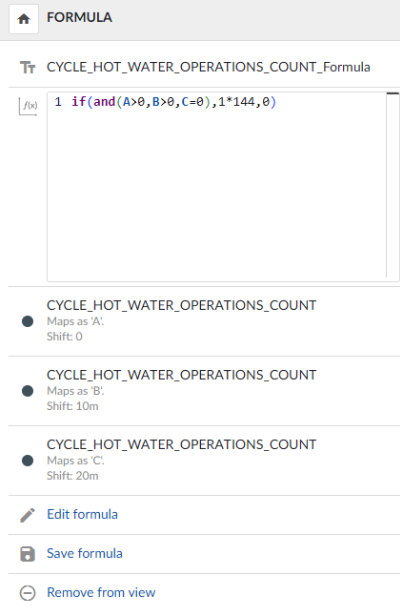
Create a tag by using a formula that shows up a spike at the beginning of each event. The spikes are a triangle with a base equal to 20 minutes. Multiplied by a factor of 144 so that the area of each triangle is equal to 1.
if(and(A=1,B=1,C=0),1*144,0)
Variable mapping:
A = Event-tag
B = Event-tag, shifted by 10 minutes
C = Event-tag, shifted by 20 minutes
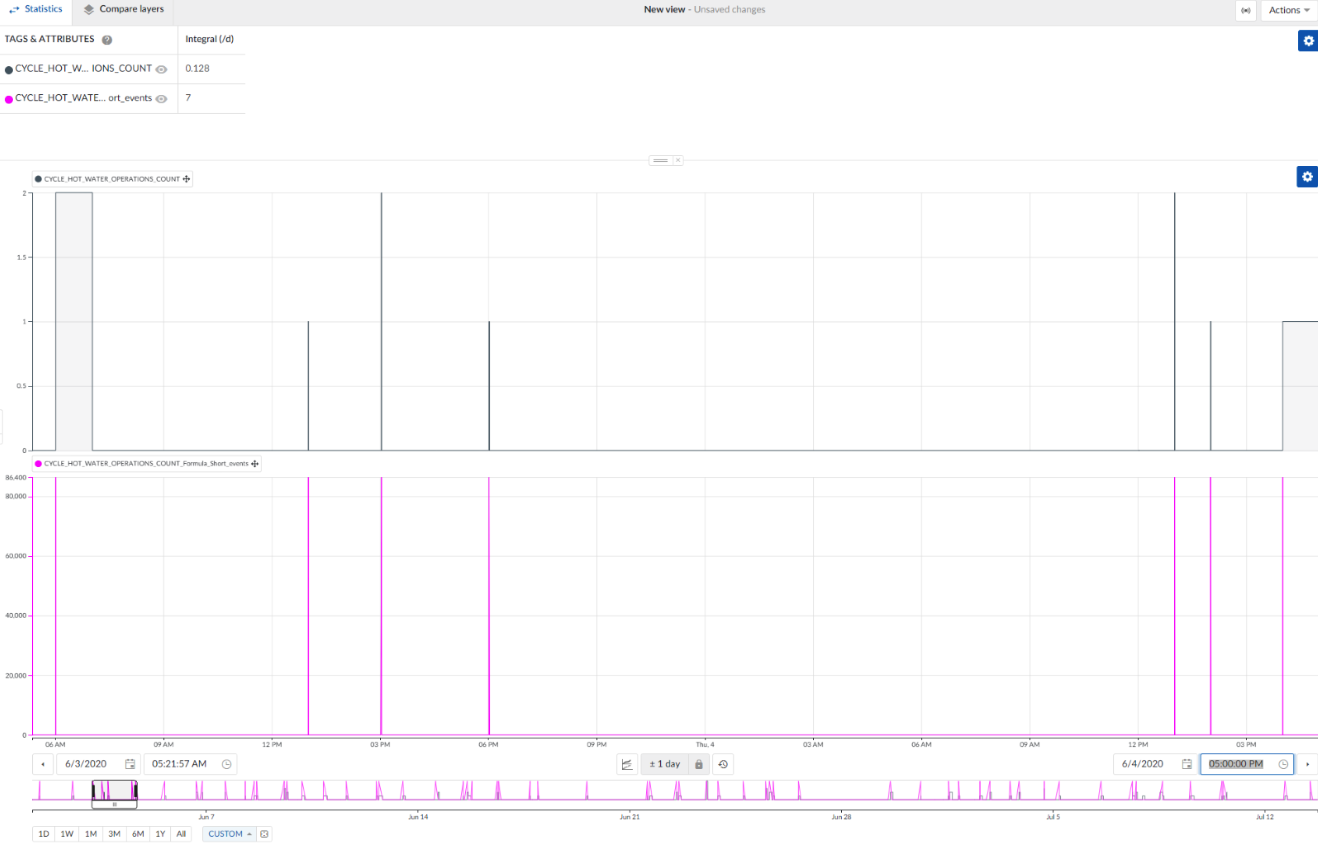
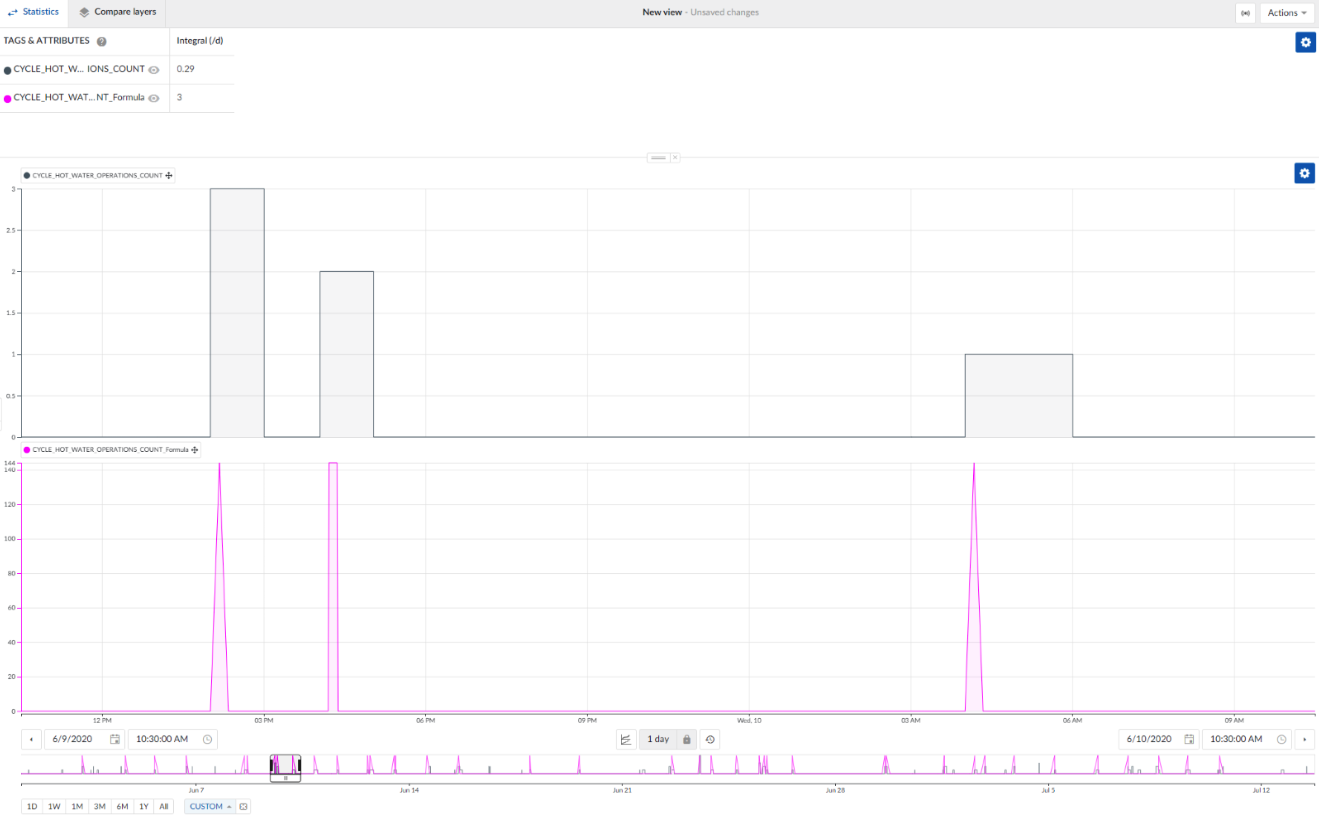
Now the statistics table can be used to get the number of events directly from the integral. You can zoom into any area and quickly see the number of events across that period. It is also possible to compare different time periods using the time tags.
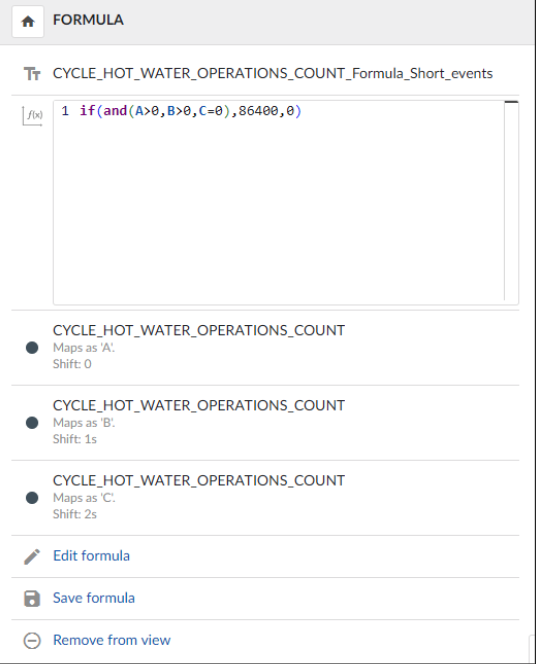
If events are short, you can use a much shorter shift in the formula, and you will get the same result. The factor needs to be adjusted in this case.