ContextHub View Tile
The ContextHub view tile enables you to visualize context data based on a saved context view.
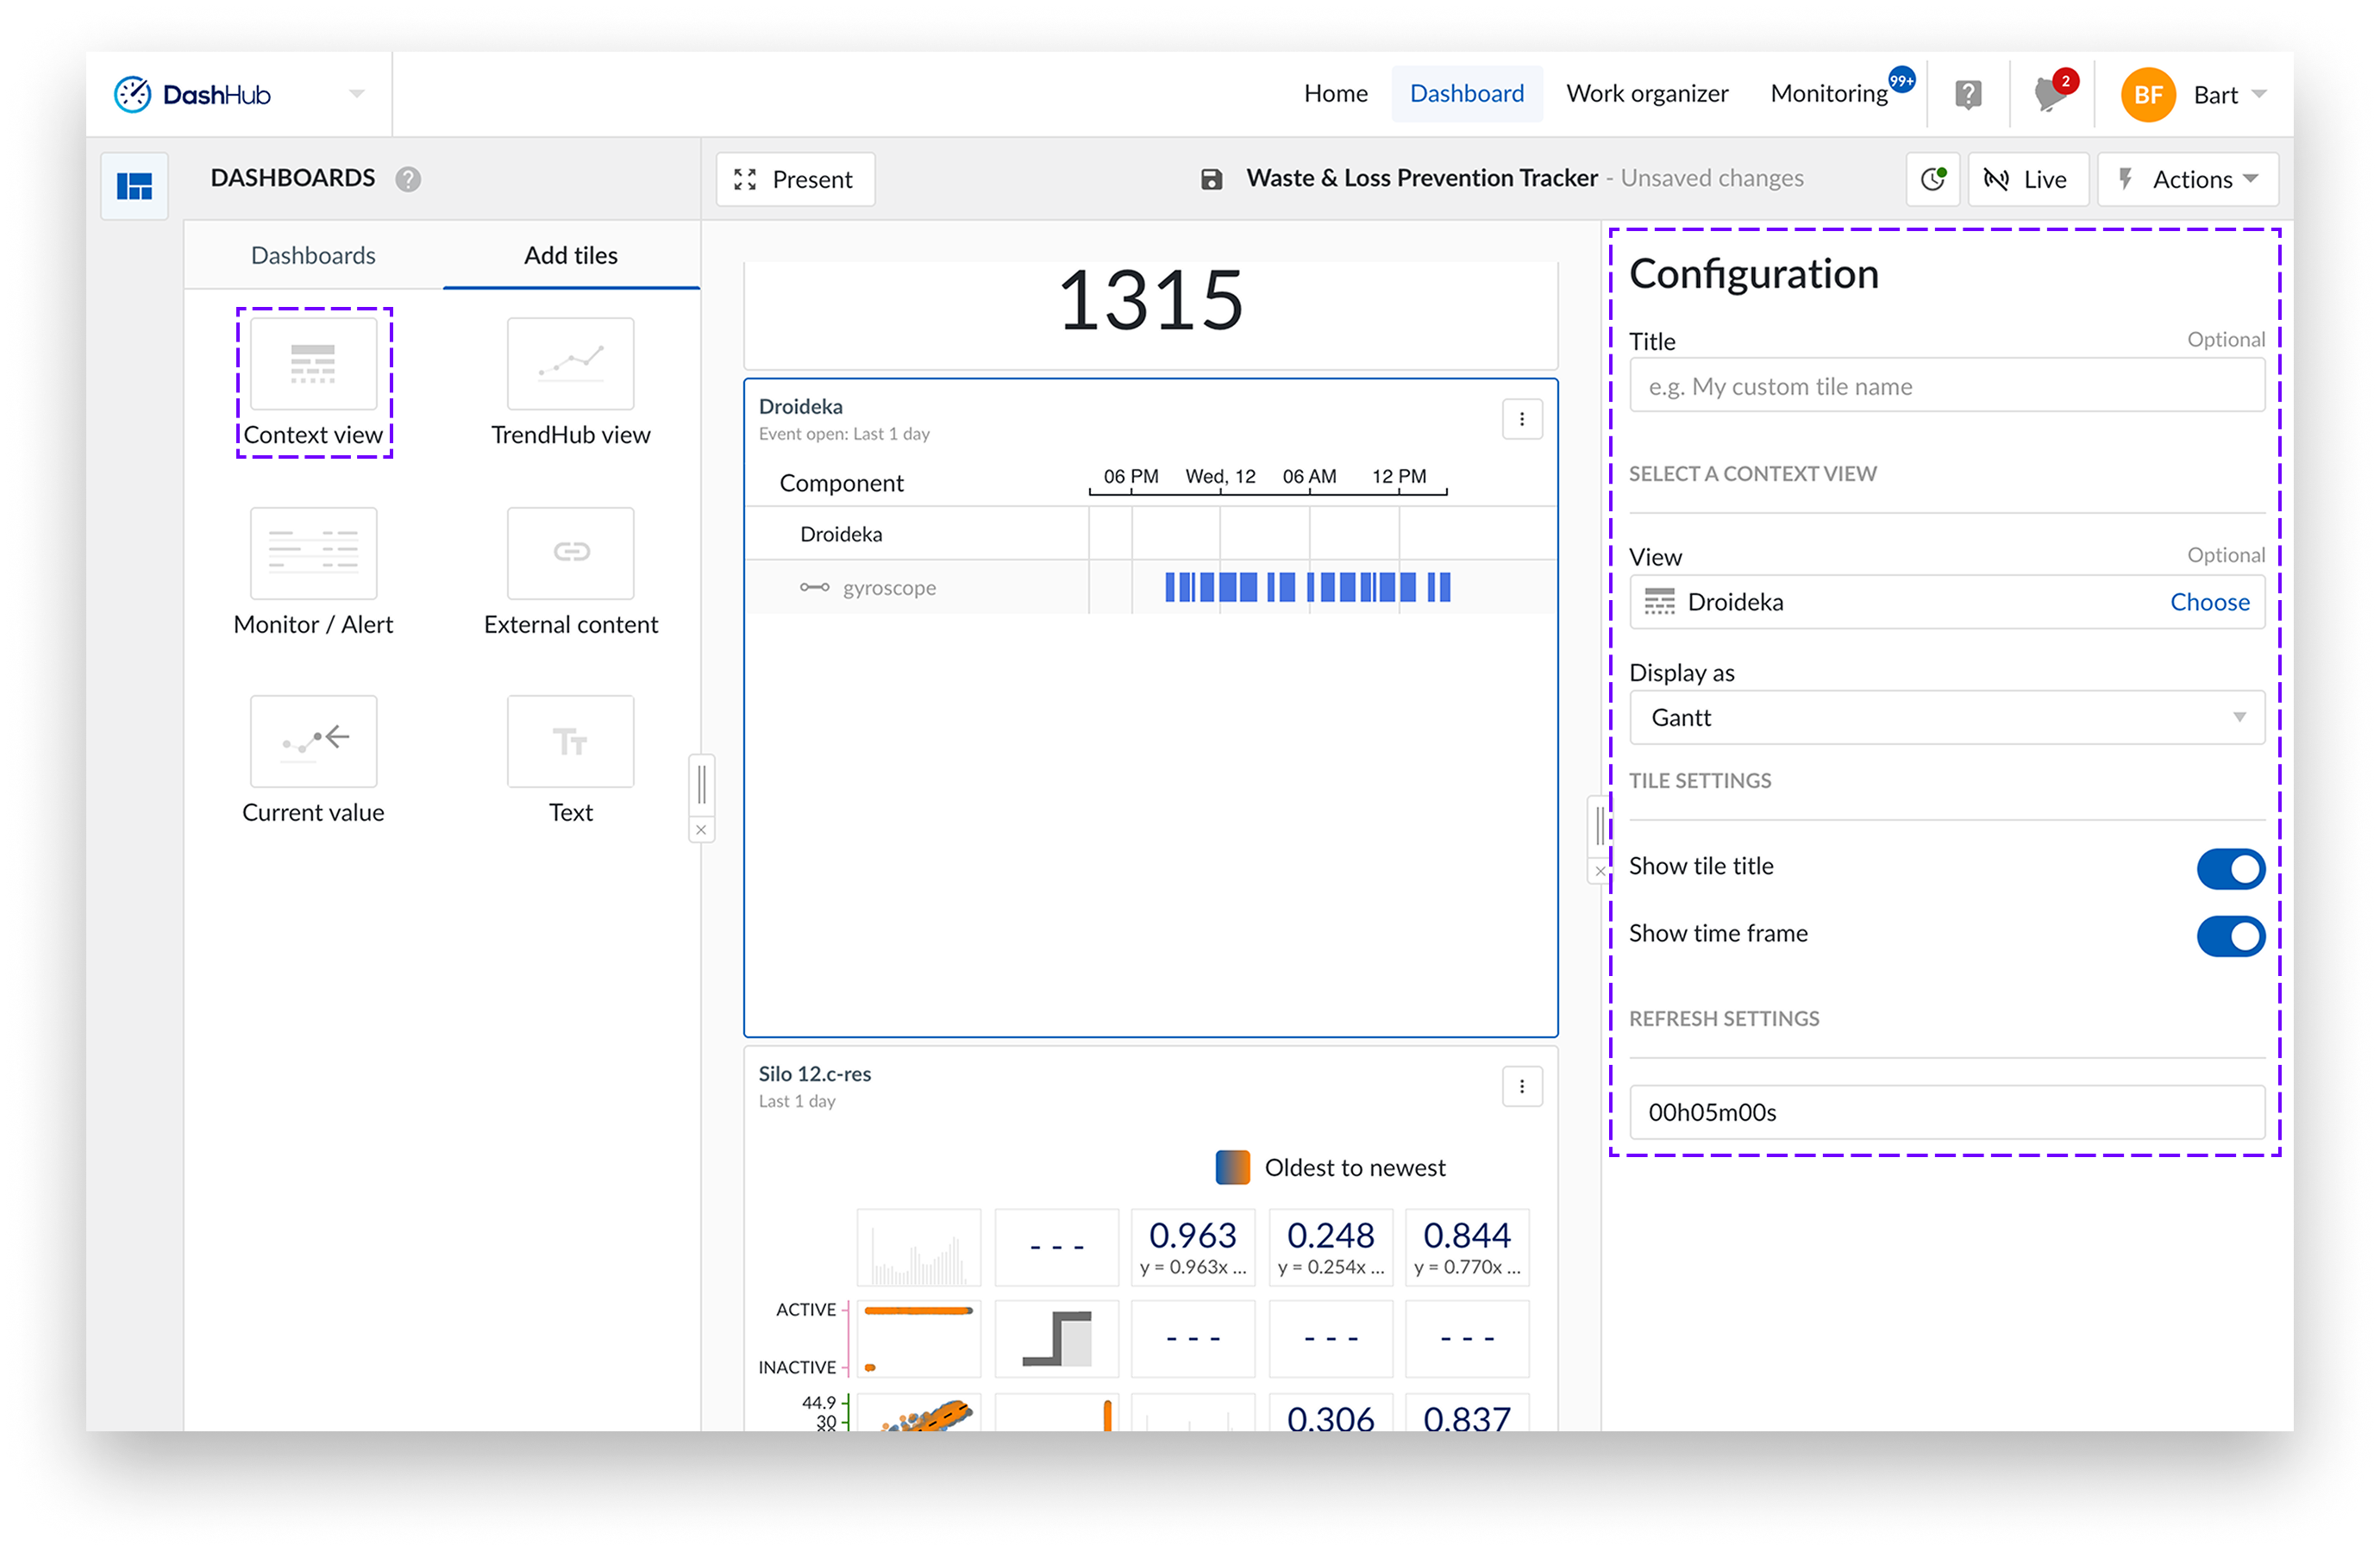
After adding this type of tile in the "Add Tiles" tab within the side panel and selecting the desired context view, you can choose a display mode. There are four display modes available, each serving a specific purpose:
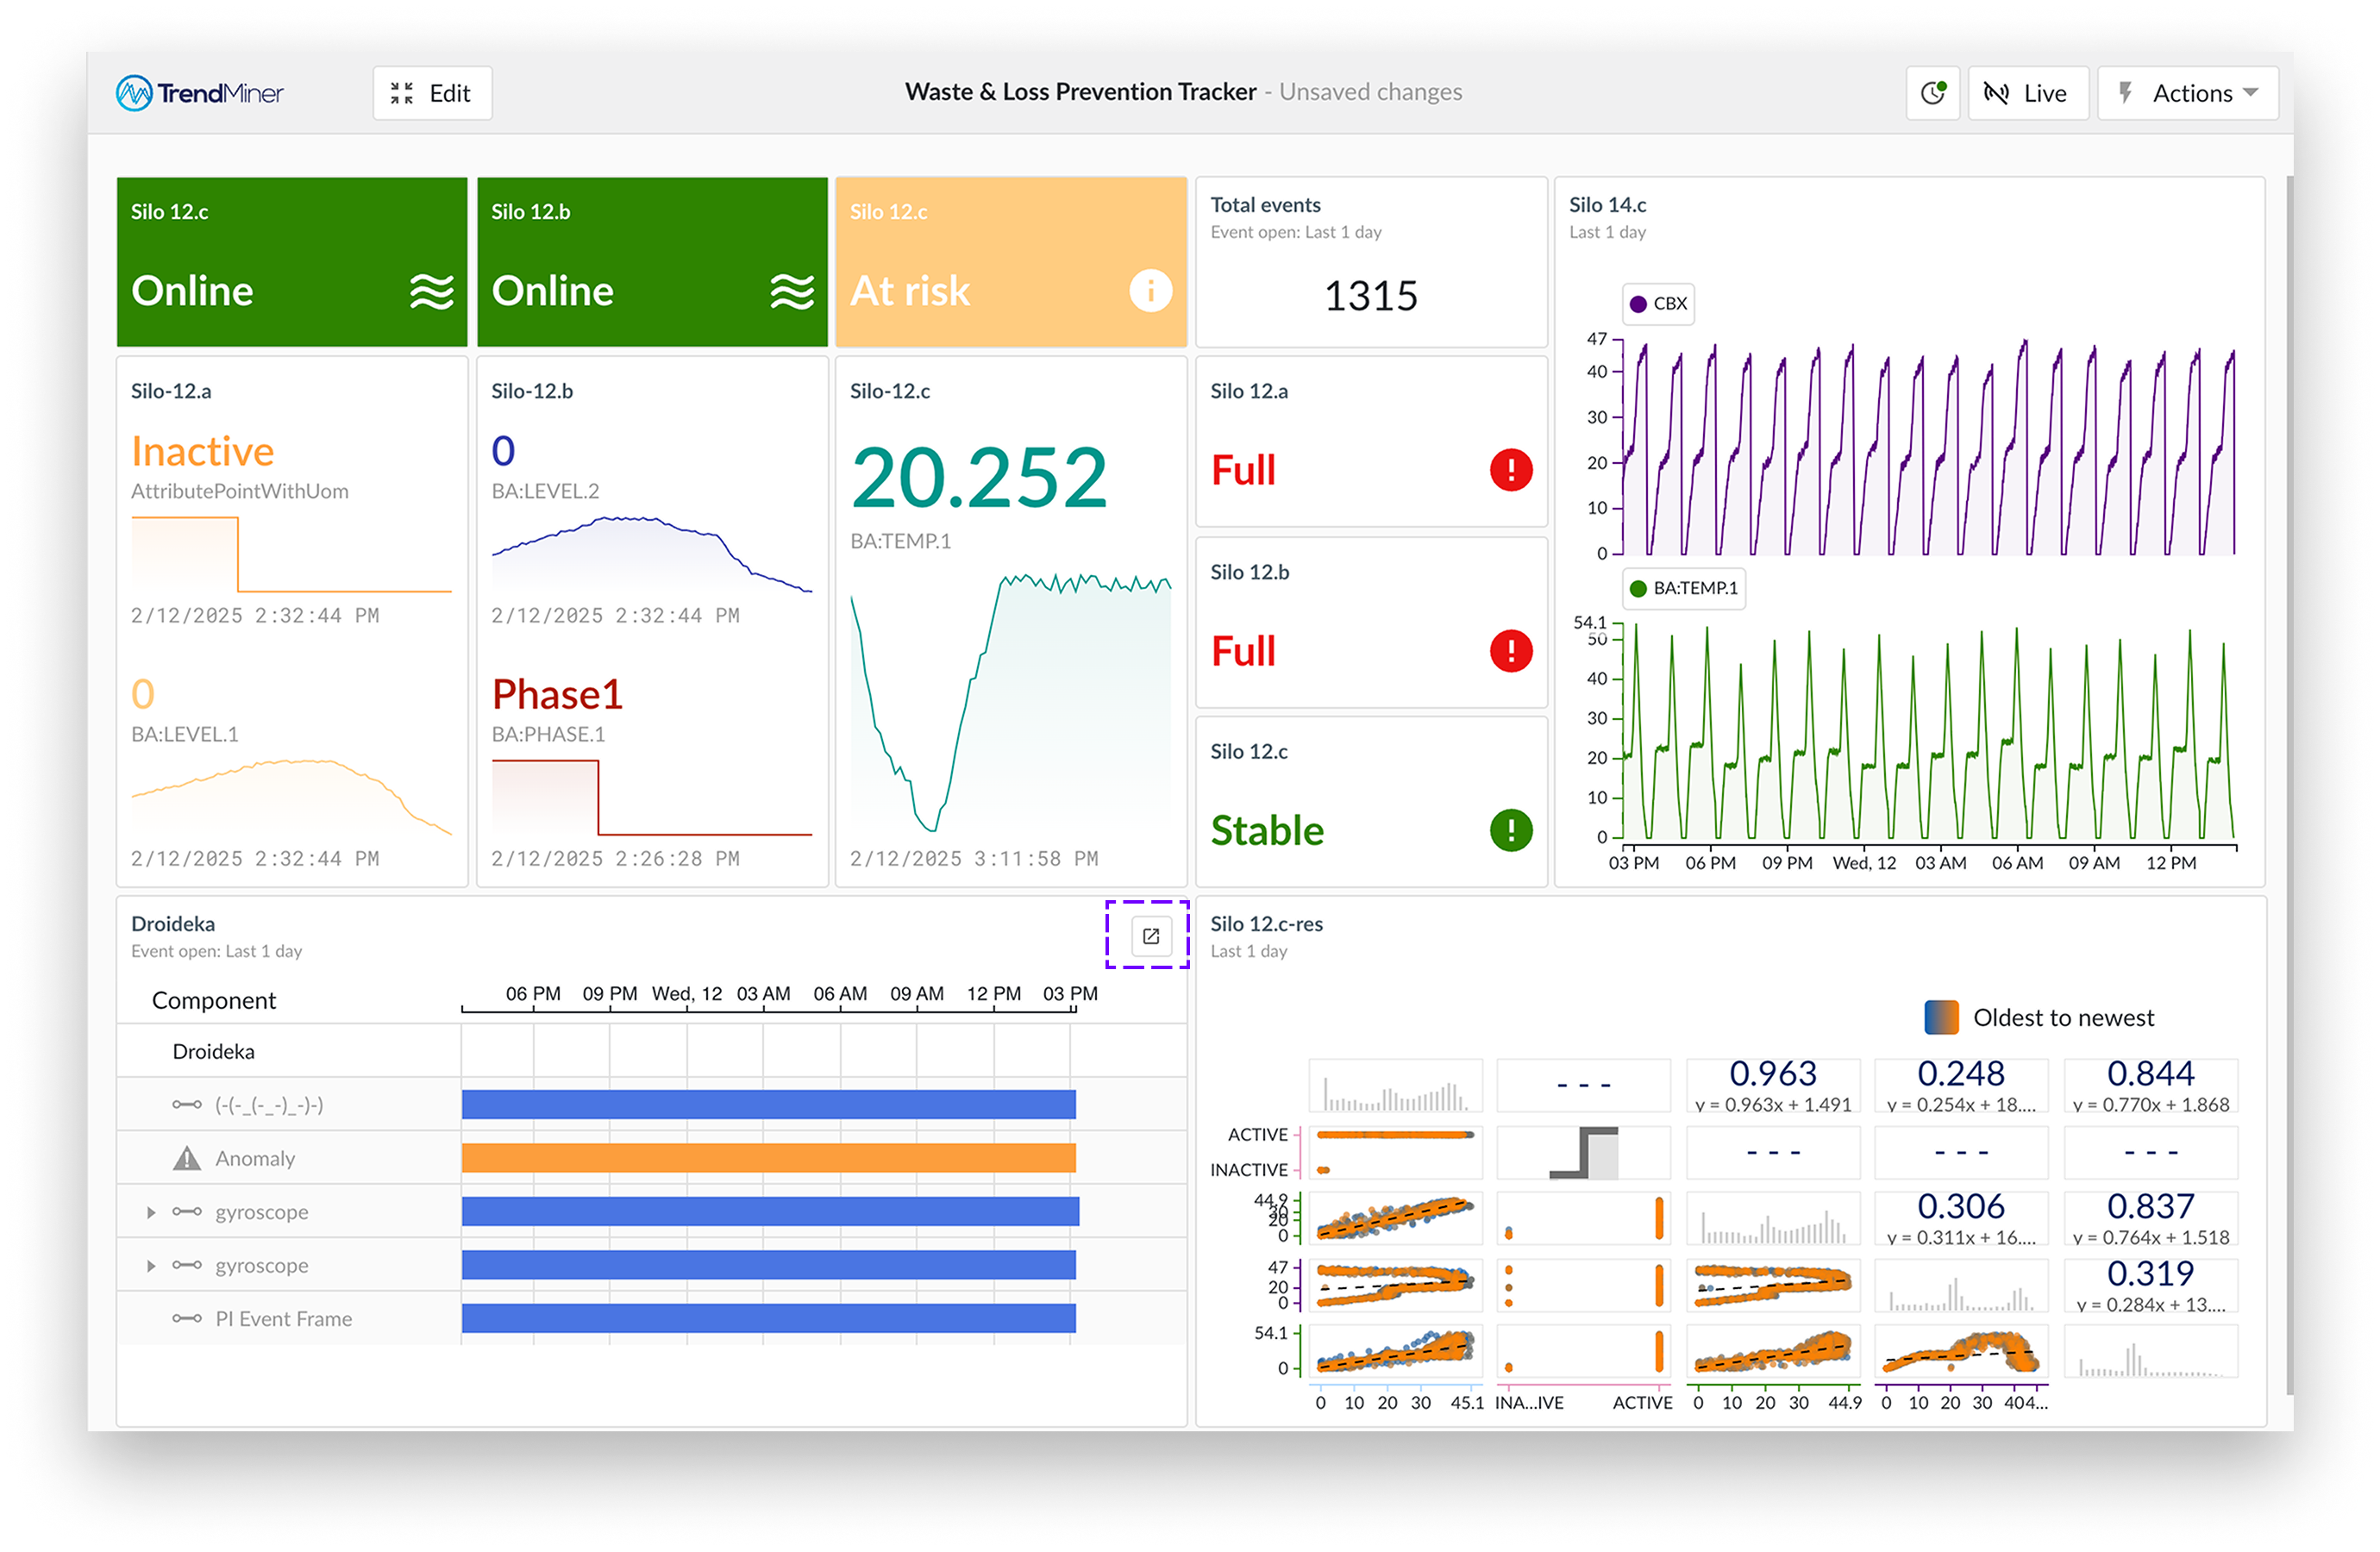
Count - The display mode "count" simply displays the number of context items within a certain context view in a clear way. This could be used, for example, to monitor event types that represent critical issues, or keep track of the number of batches produced by a production line over a given time period.
Table - The "table" display mode allows you to directly embed a ContextHub table into DashHub. The table configuration (columns, sorting, etc.) is directly inherited from the corresponding context view. You can interact directly with context items in the table, as clicking on any row in the table will open the context item detail panel.
Gantt - Similar to the "table" display mode, the "Gantt" display mode will directly embed a ContextHub Gantt chart into DashHub. The Gantt configuration (timeframe, pinned rows, etc.) is directly inherited from the corresponding context view. You can interact directly with the context items on the chart, as clicking on any item will open the context item detail panel.
Scatter - The "Scatter" mode displays context items in a scatter plot, useful for analyzing trends and correlations. The plot’s configuration is inherited from the context view.
Note
Some display modes are only available if the selected view meets certain criteria.
The "Gantt" display mode is only available if the selected view contains a component filter.
Display as scatter is only available for ContextHub views with a type filter.
Start a new or open an existing dashboard.
Select "Add tiles" to create a new tile. You can add the tile to the dashboard by either dragging the tile to the dashboard or double-clicking it.
A side panel appears from the right side of the screen.
Add a title of your choice. By default, it takes the name from the view.
Click the "Select a view" to open the work organizer, and choose a view.
Select the context view of your choice.
Select the display mode of your choice (Count, Table, Gantt or Scatter).
Hover over the Context view tile and click the arrow icon in the top right corner of your tile and select "View in ContextHub," or simply click the title of the context tile.