TrendHub View Tile
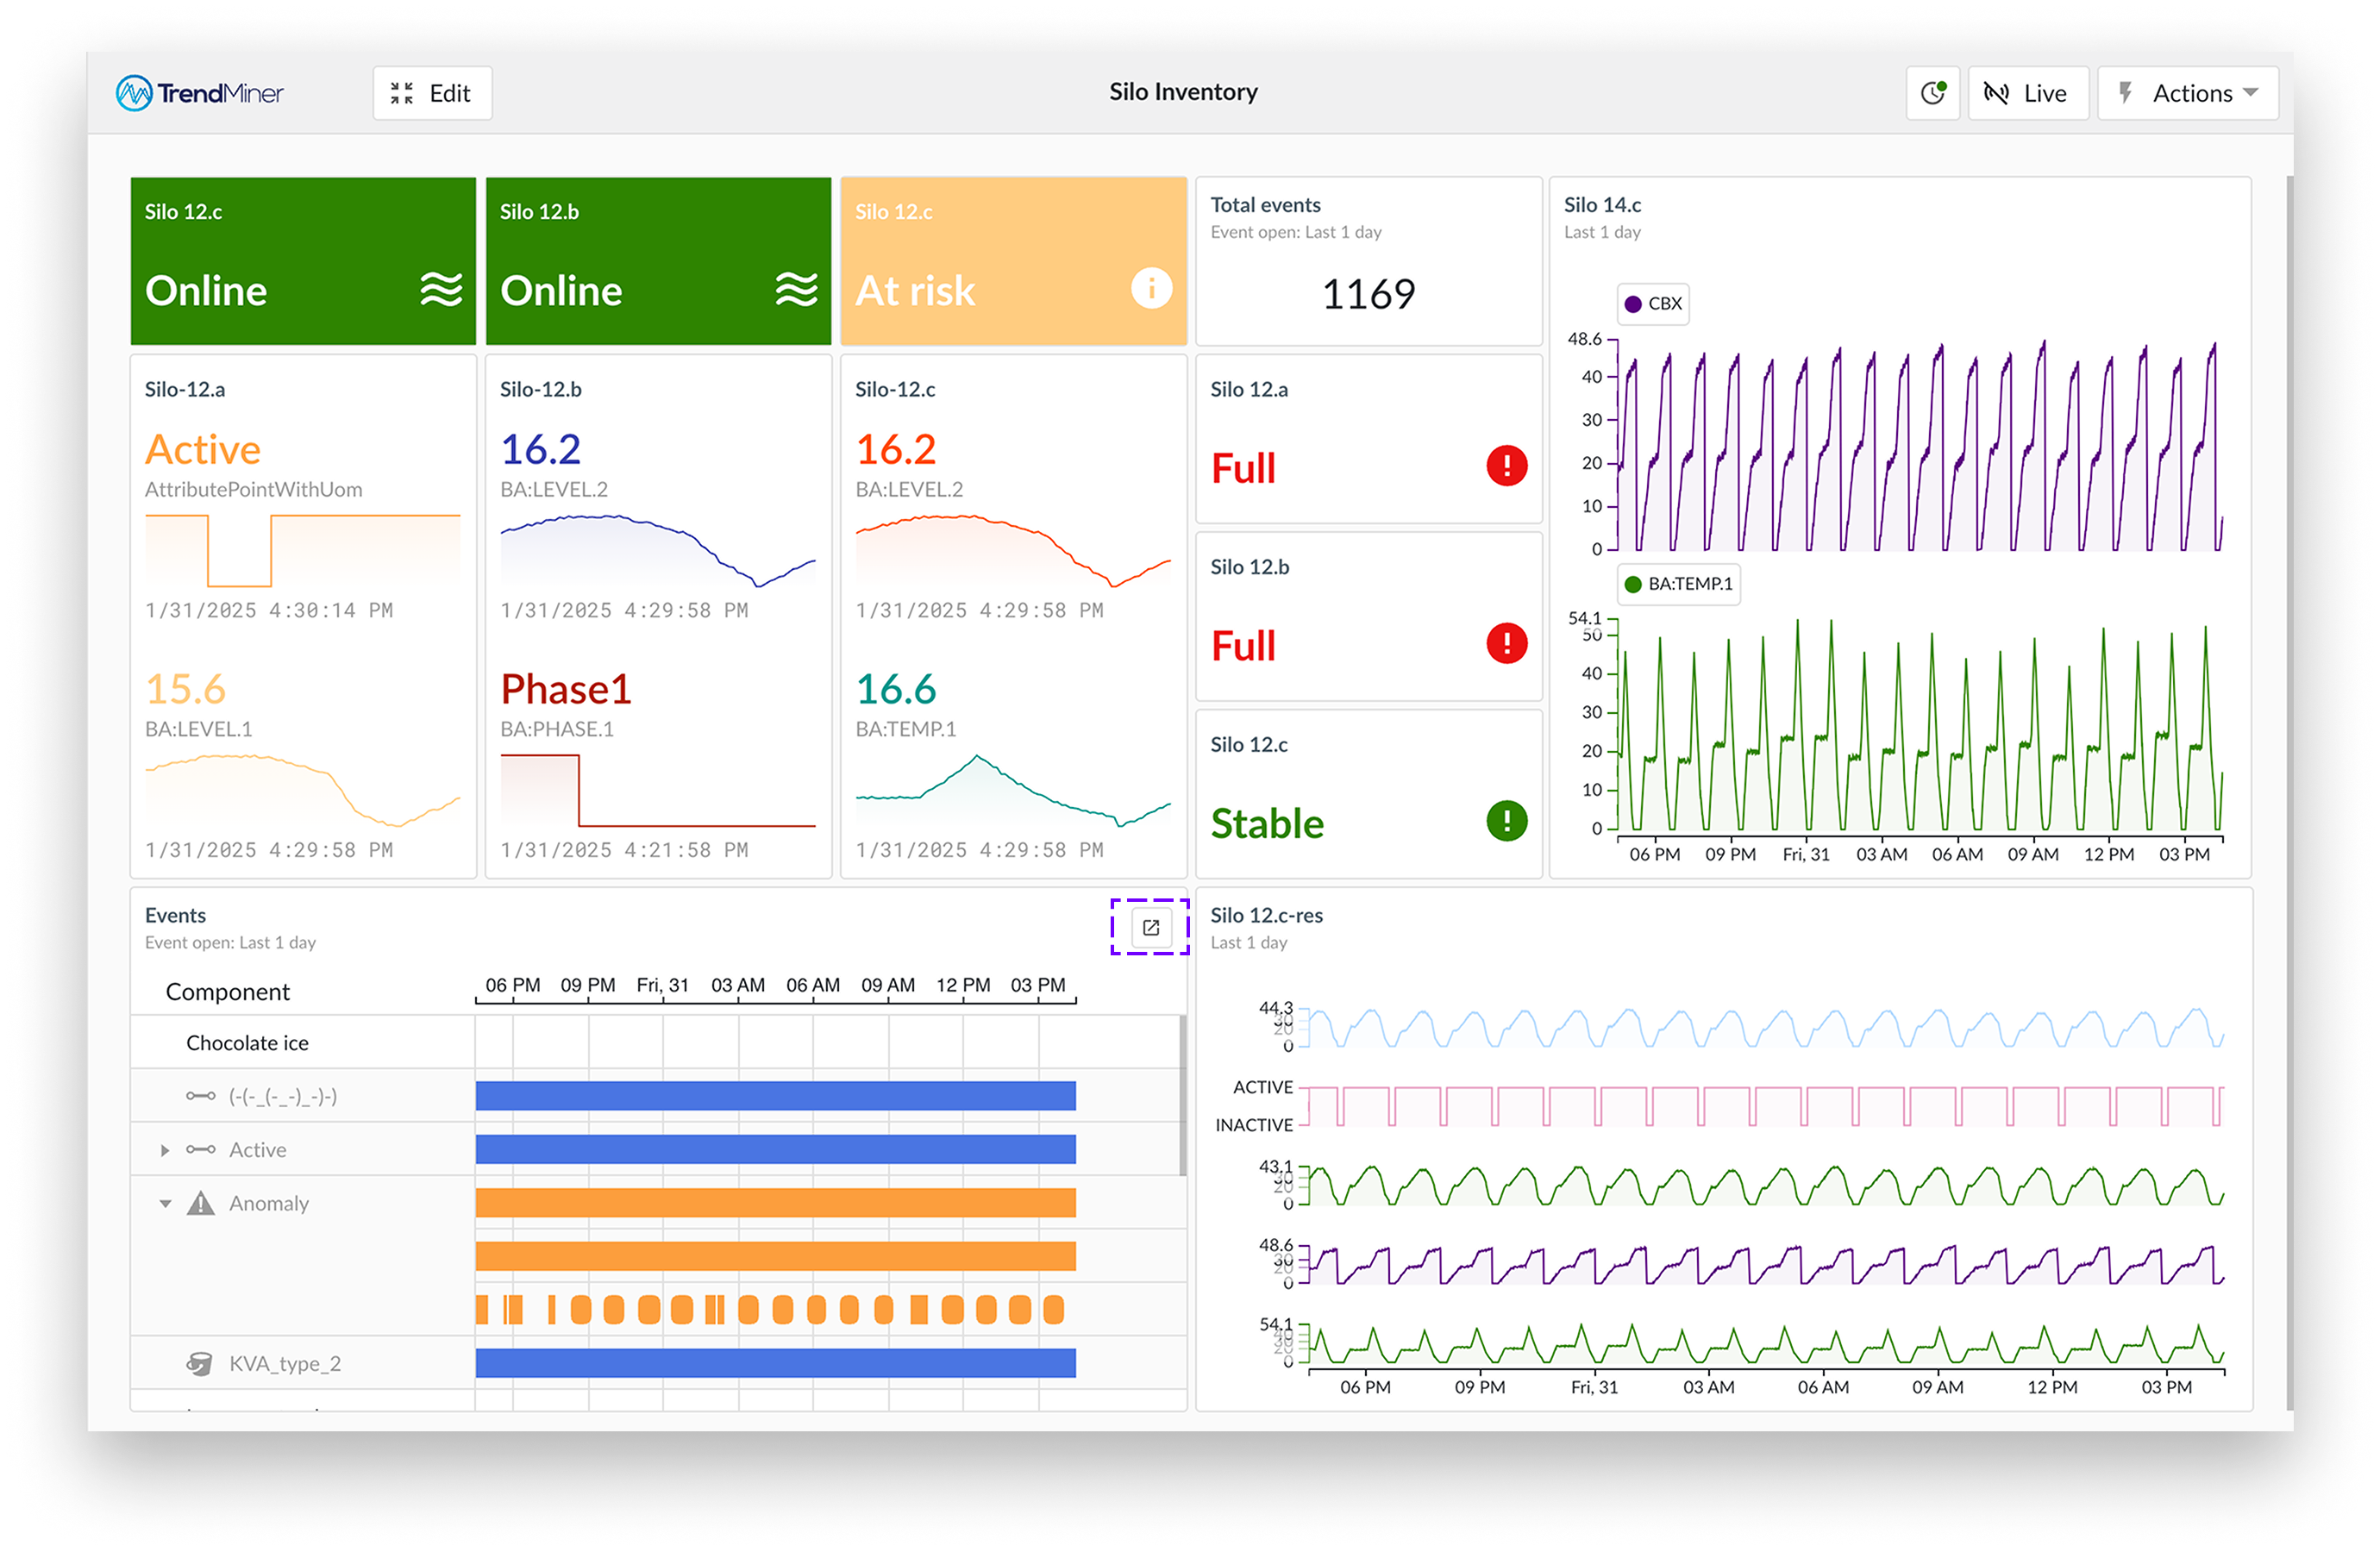
Trend tiles bring your data to life by displaying key insights from a TrendHub view, featuring trend plots, stack plots, and scatter plots. Settings configured in the TrendHub view, such as grid lines, context items, and trendline filling, are carried over and make it easier to spot trends and gain deeper insights at a glance.
Available tile settings:
Show tile title
Show time frame
Show component names
Show legend
Show context items
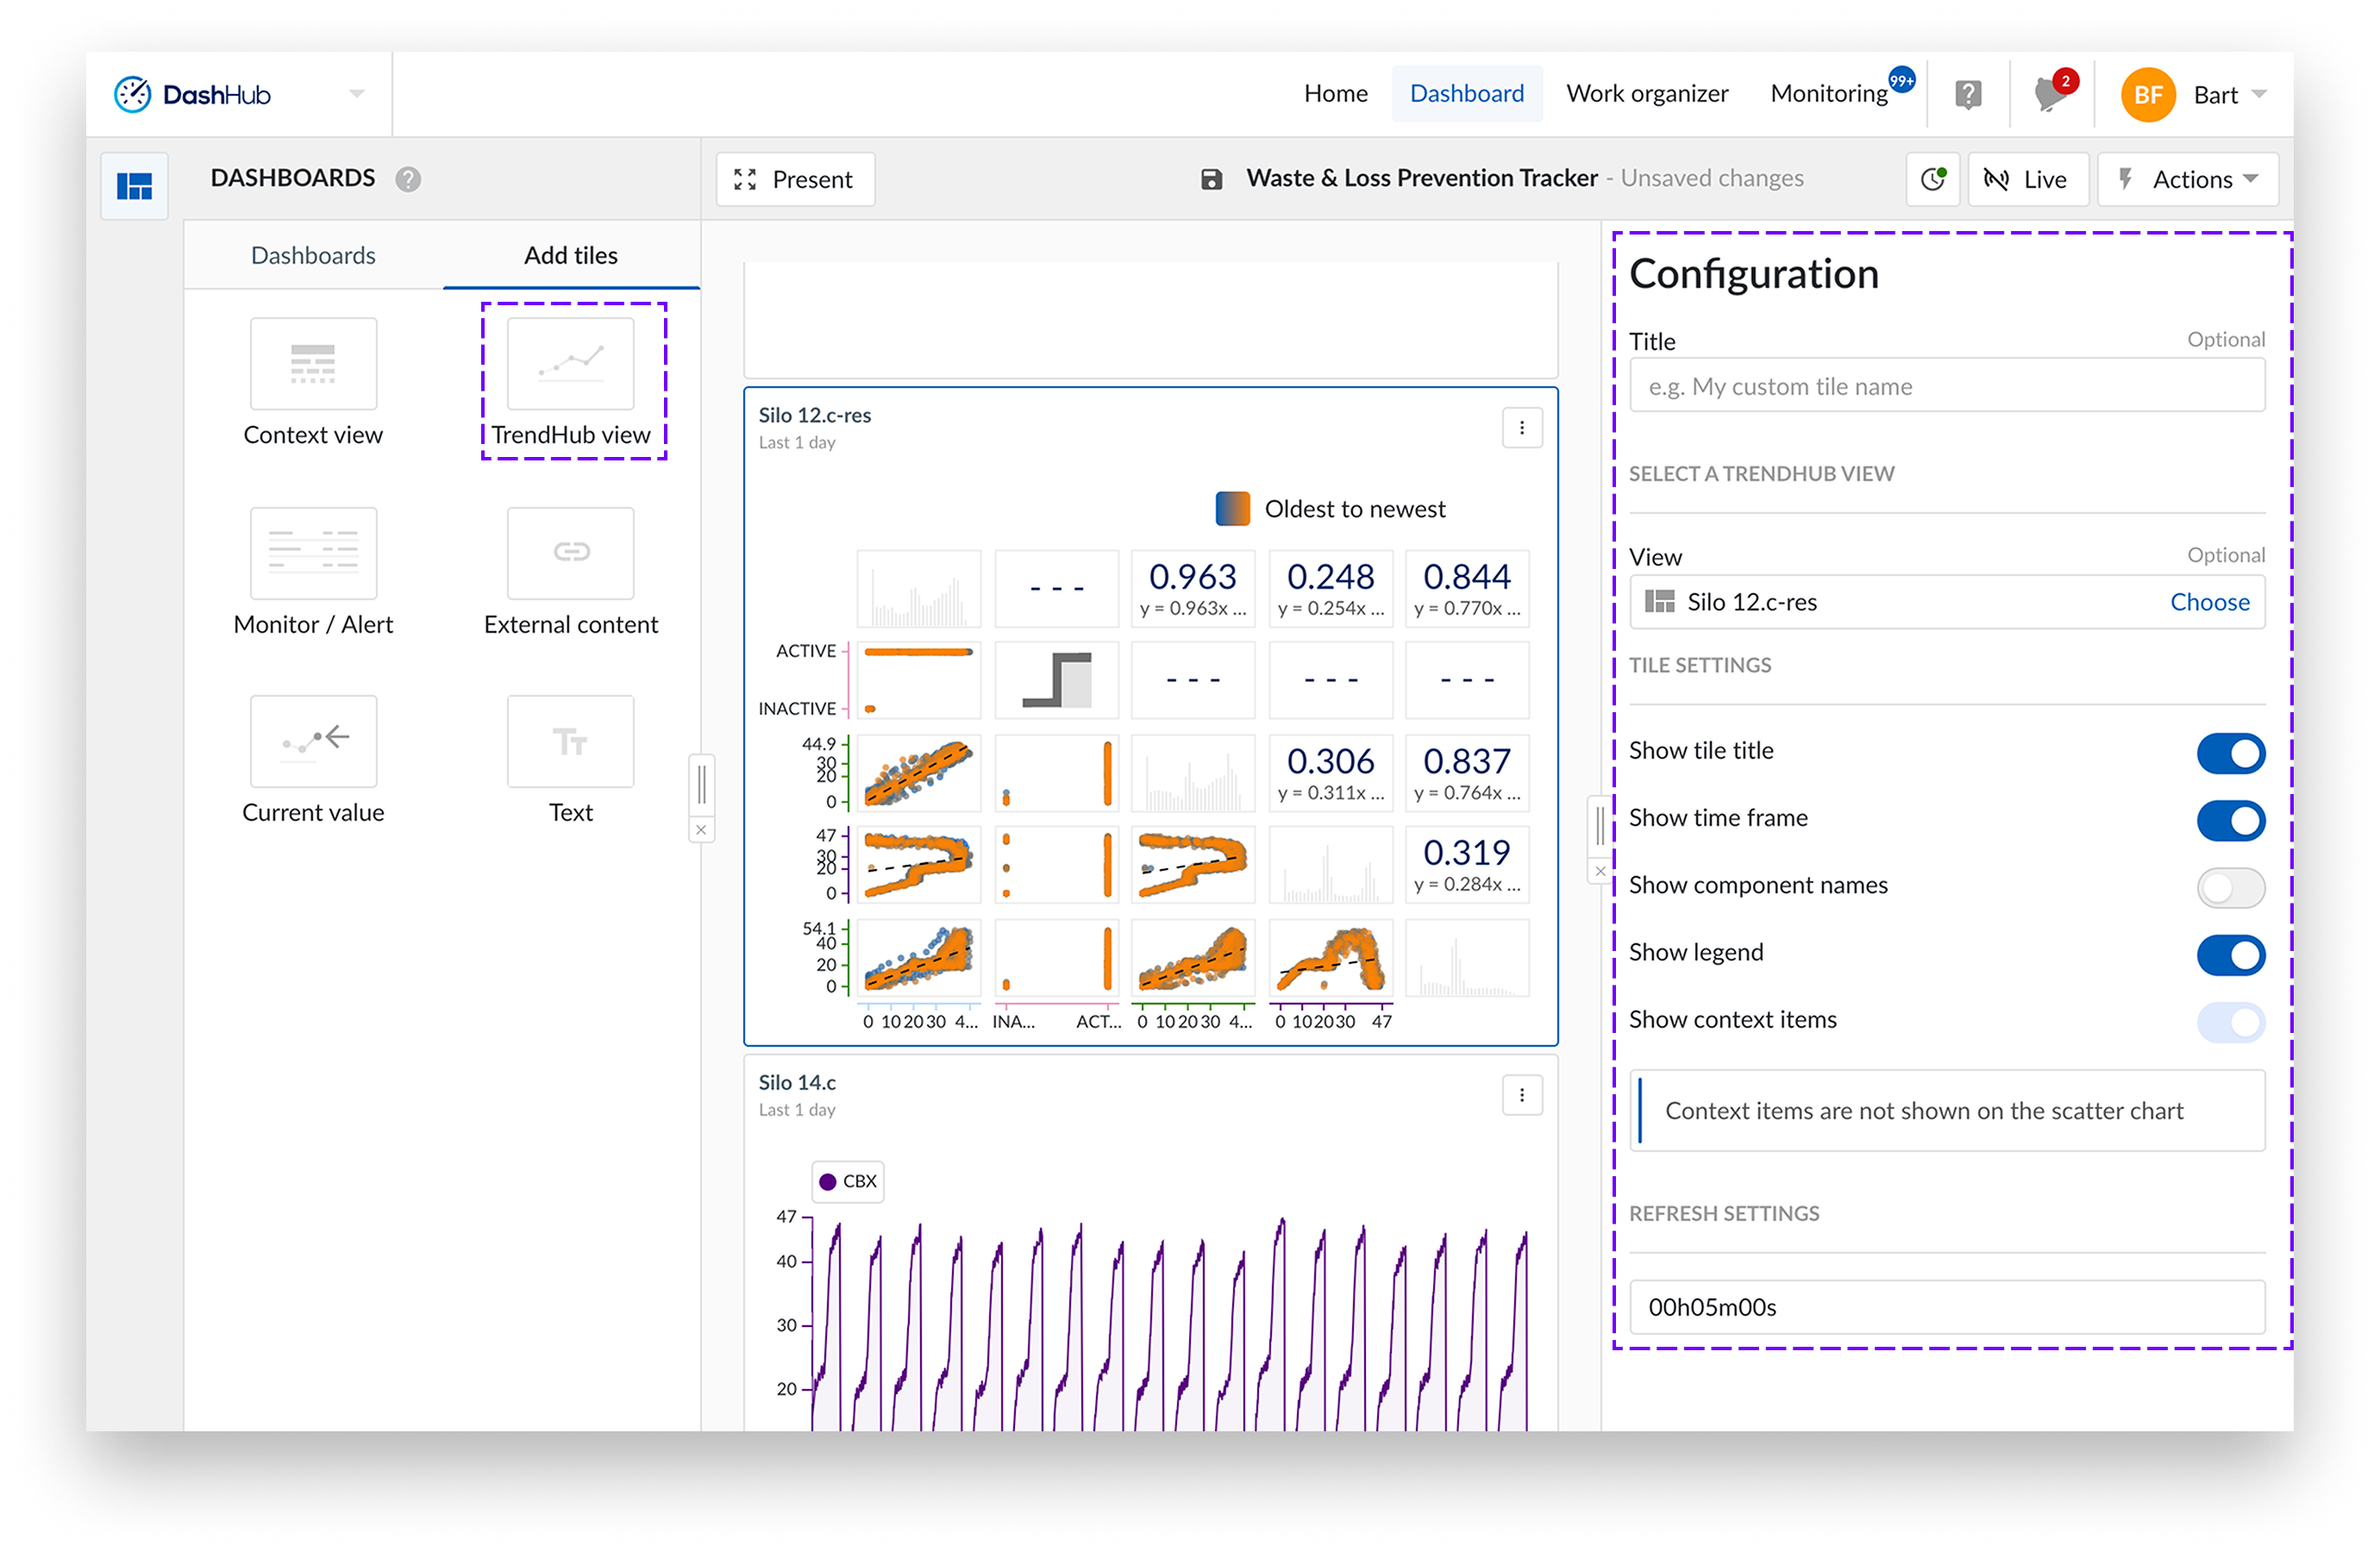
Start a new or open an existing dashboard.
Select "Add tiles" to create a new tile. You can add the tile to the dashboard by either dragging the tile to the dashboard or double-clicking it. A side panel appears from the right side of the screen.
Add a title of your choice. By default, it takes the name from the view.
Click the "Select a view" to open the work organizer, and choose a view.
Select the trend view of your choice.
Check the “Show context items” checkbox if you would like to also visualize context items directly on the tile. If the “Show context items” checkbox has been selected, context items corresponding to the selected components will appear on the chart.
Hover over the trend tile and click the arrow icon in the top right corner of your trend tile or simply click the title of the trend tile.