Innovation Highlights
The 2026.R1.0 release brings meaningful improvements to how your teams analyze data, manage infrastructure, and integrate with plant systems.
This release introduces Collapsed Plotting, which strips away filtered noise so analysts can focus on what matters-a cleaner view that flows directly into your dashboards. Context fields are now more configurable and readable, giving administrators finer control over how information is structured and displayed across your organization.
On the infrastructure side, a modernized SMTP configuration supporting major enterprise email providers out of the box, and Plant Integrations V5 simplifies deployment significantly - a single installer replaces complex manual configuration, with added HTTPS and authentication support to secure environments. Index storage visibility tools also make it easier to monitor and optimize disk usage without disrupting ongoing analysis.
Rounding out the release are targeted enhancements across DashHub, MLHub, Work Organizer, and the context webhook - plus a new Python 3.14 kernel and expanded Canary Historian support.
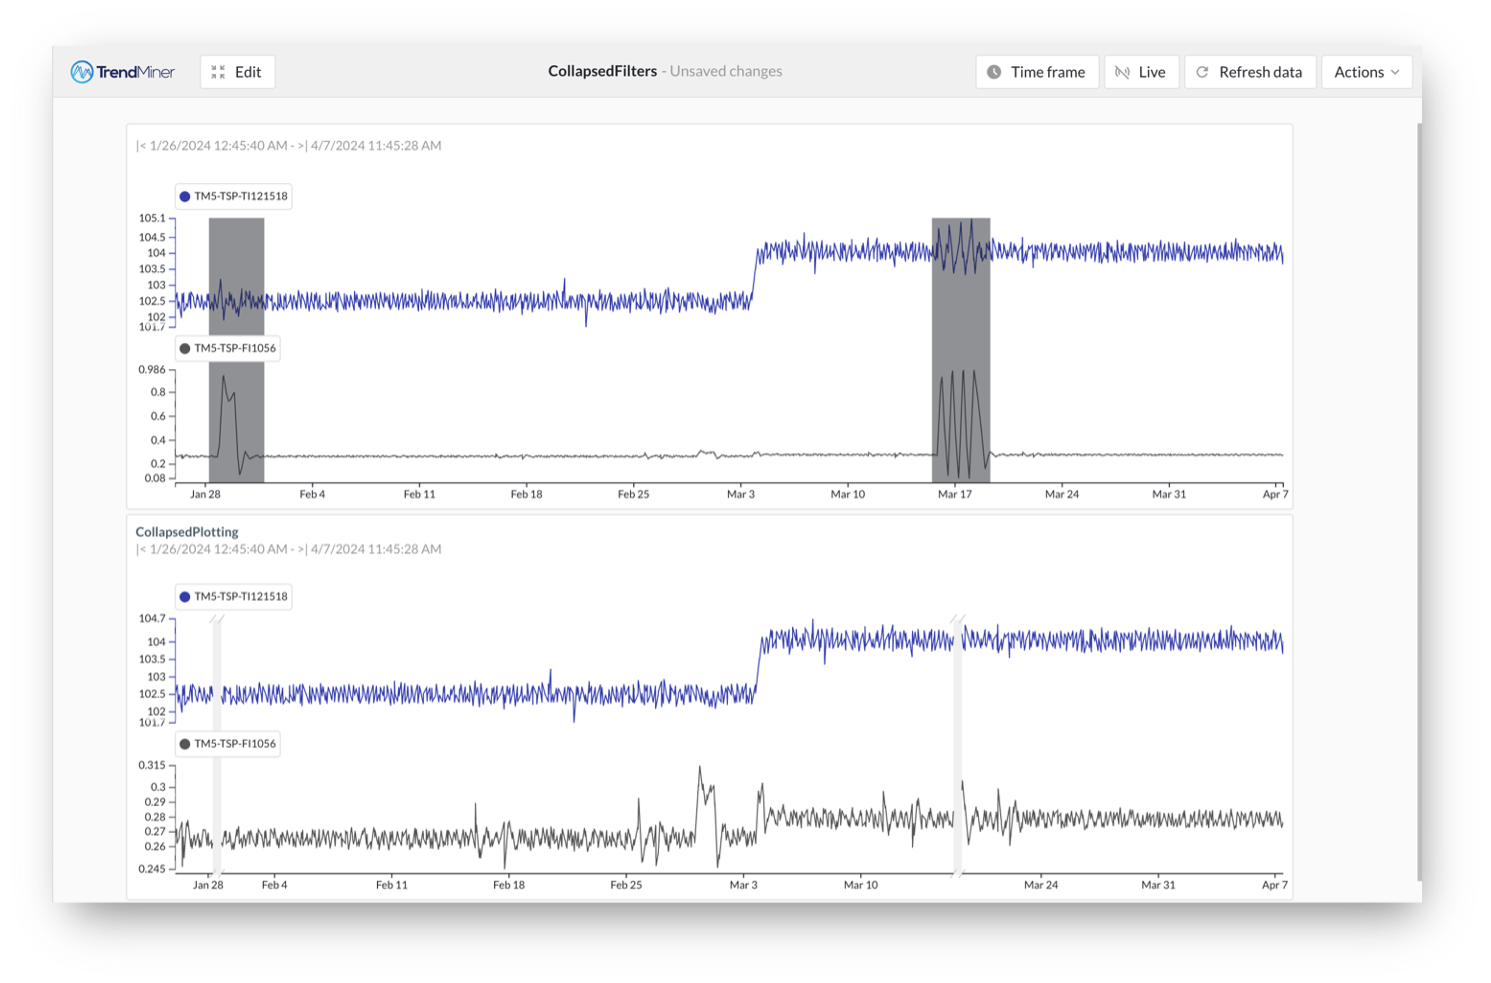
Collapsed Plotting
Remove the noise and focus in on the data pertinent to your analysis. When filters are active, you can now collapse filtered periods on trend and stacked trend plots, stitching unfiltered data seamlessly together. Filtered regions are replaced by collapsed indicators, and visible data scales to fill the entire chart — making patterns immediately obvious.
This cleaner view carries directly into DashHub, so your TrendHub View Tiles always show the focused, noise-free visualization your team needs at a glance.
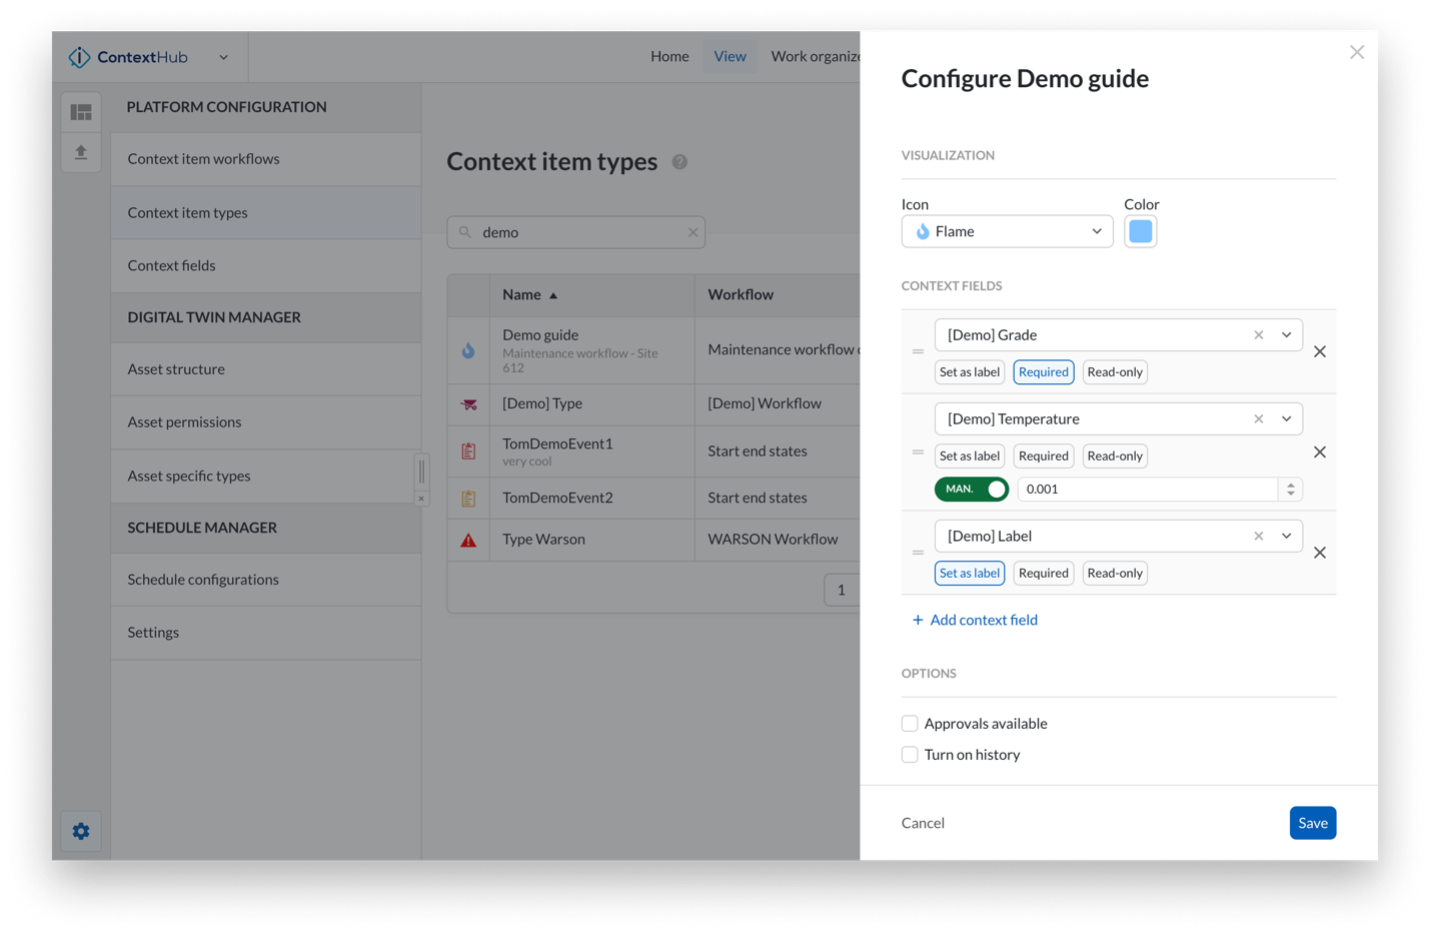
Smarter context field configuration, tailored per context type
Context fields are more customizable for improved readability and dependability. In ContextHub, you can mark a field as required, set it to read-only after creation, define the number of decimal places displayed for numeric values, and control the order in which fields appear, all per context type. A new optional Description field also lets you document the purpose of a context item type, shown below the type name when selecting one from a dropdown.
Contextual field filter in searches
When one or more context types are selected in the filter, the Field filter now shows only fields that belong to those types.
Visual improvements to the context item detail modal
Conditional formatting defined in a context table view is now also applied in the detail modal when it is opened from within that view. Field values starting with http(s):// are automatically displayed as clickable links.
Index storage visibility and optimization
You can now assess your index storage consumption and take action to optimize it. From ConfigHub, generate a report that shows exactly how much disk space your index data uses and how much you can recover by adjusting the horizon. The same report identifies which similarity searches would be affected, helping you assess trade-offs and communicate with users before making changes.
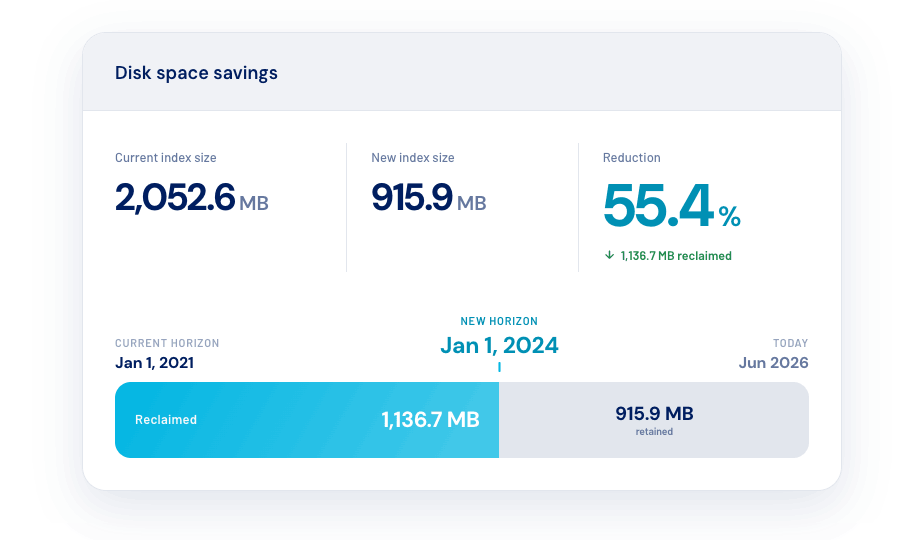
When you adjust the index horizon to a more recent date, index data before that date is automatically deleted to free disk space. A notification confirms when the deletion is complete.
Fresh installations starting with 2026.R1 default to a three-year horizon, balancing analytical depth with storage efficiency.
Edge Manager – SMTP Modernization
We have modernized TrendMiner's SMTP infrastructure to meet the security and configurability standards expected in enterprise environments.
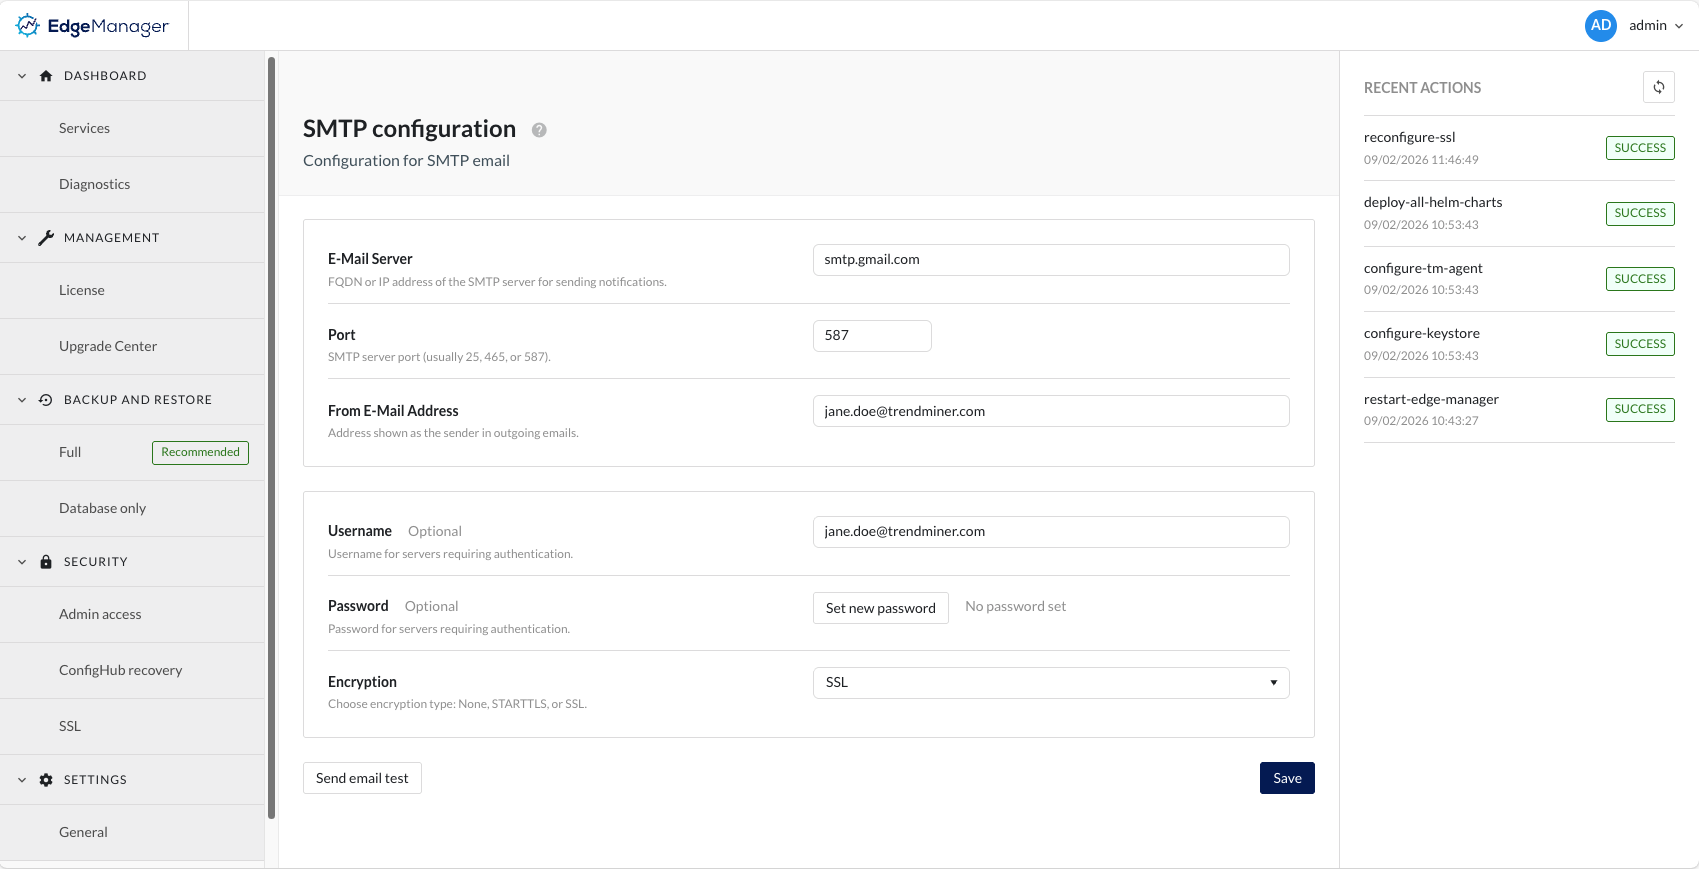
Administrators can now fully configure SMTP settings directly from the EdgeManager, including custom host and port, username/password authentication and encryption options. With this release TrendMiner can be used with commonly used SMTP providers such as Amazon SES, Microsoft 365 and Google Workspace.
This new configuration option ensures reliable email notifications while aligning with your organization's security requirements.
PlantIntegrations V5 - General Availability
We have fully rebuilt TrendMiner's connectivity layer to make connecting your data sources simpler, more secure, and easier to maintain.
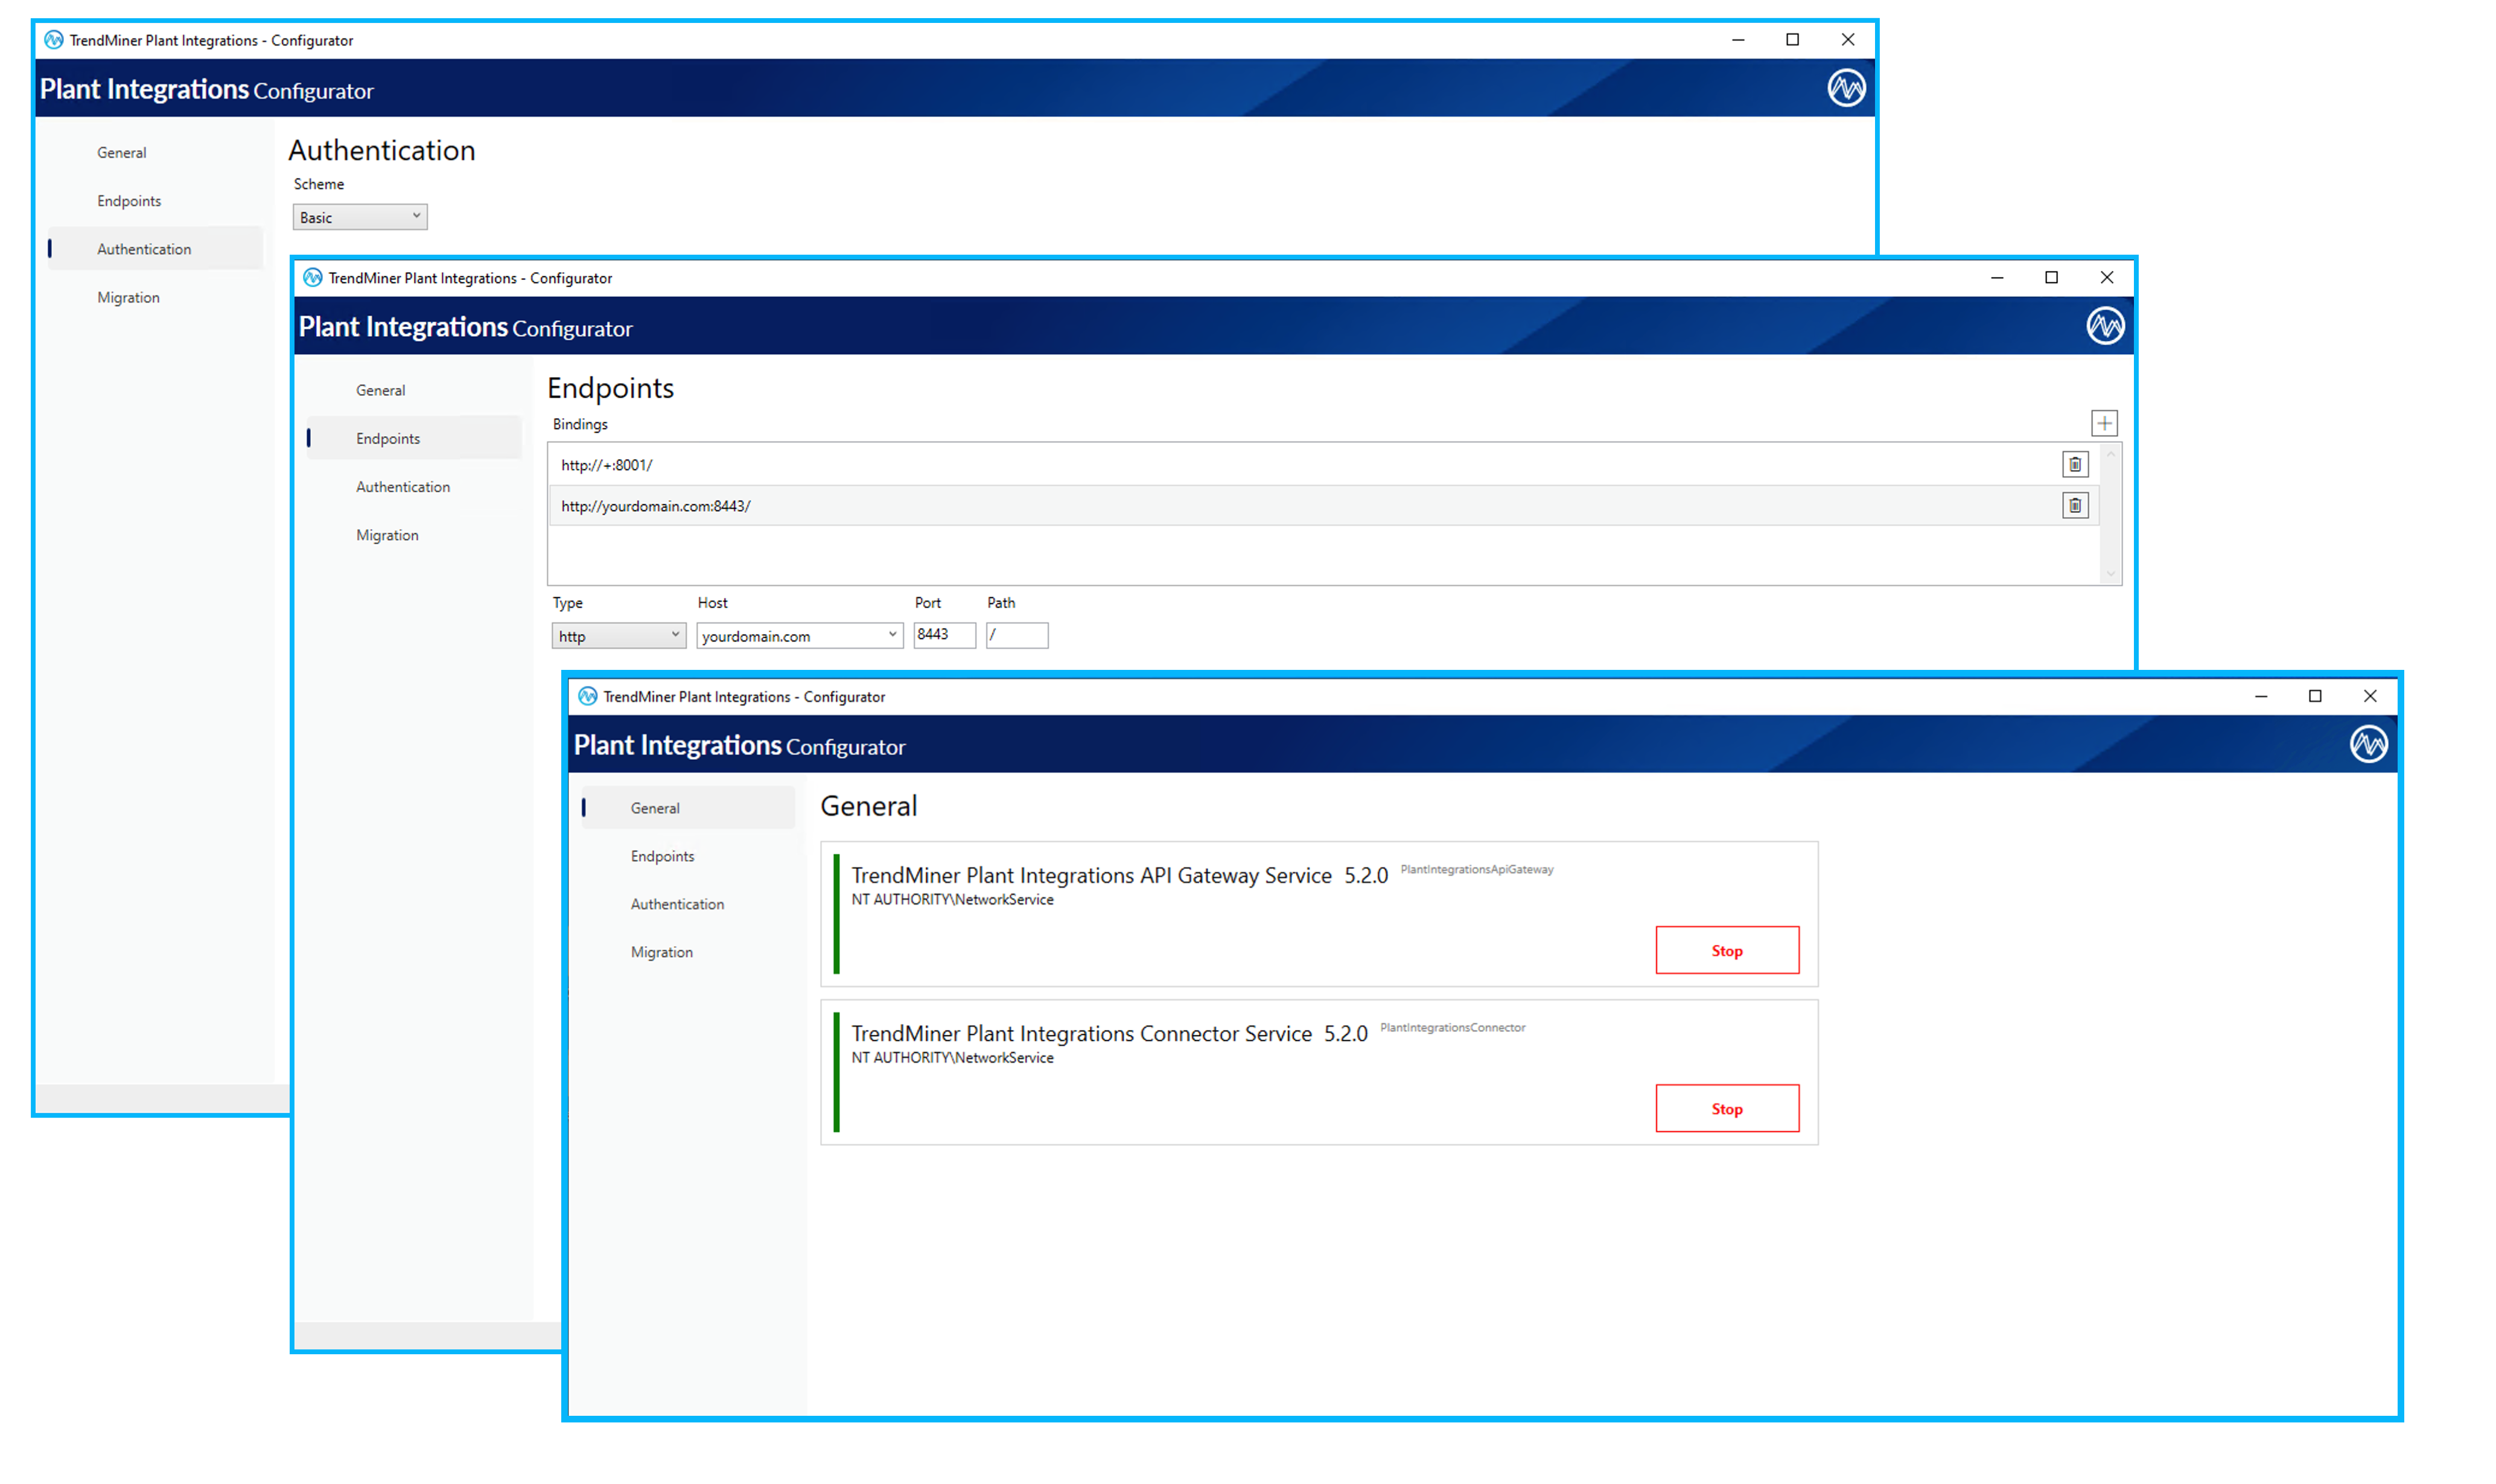
Administrators can now deploy Plant Integrations with a single installer that handles everything automatically - no IIS required, no manual configuration files to manage. All settings are stored centrally, ensuring nothing is lost during upgrades and reducing the time needed to get up and running.
With this release, Plant Integrations adds support for HTTPS encryption and Basic Authentication, allowing it to be deployed in enterprise IT environments that require secure, authenticated communication between systems.
Plant Integration V5 reduces the number of moving parts, removes legacy dependencies, and is built to meet the security standards your organization expects — making it simpler to operate and ready to scale.