Dashboard operations
Dashboards support key interactions that help you monitor and explore data efficiently.
The most important features include global time frame adjustment, live mode for continuous updates, clickthrough to access detailed views, and the quick start panel for fast navigation across dashboards.
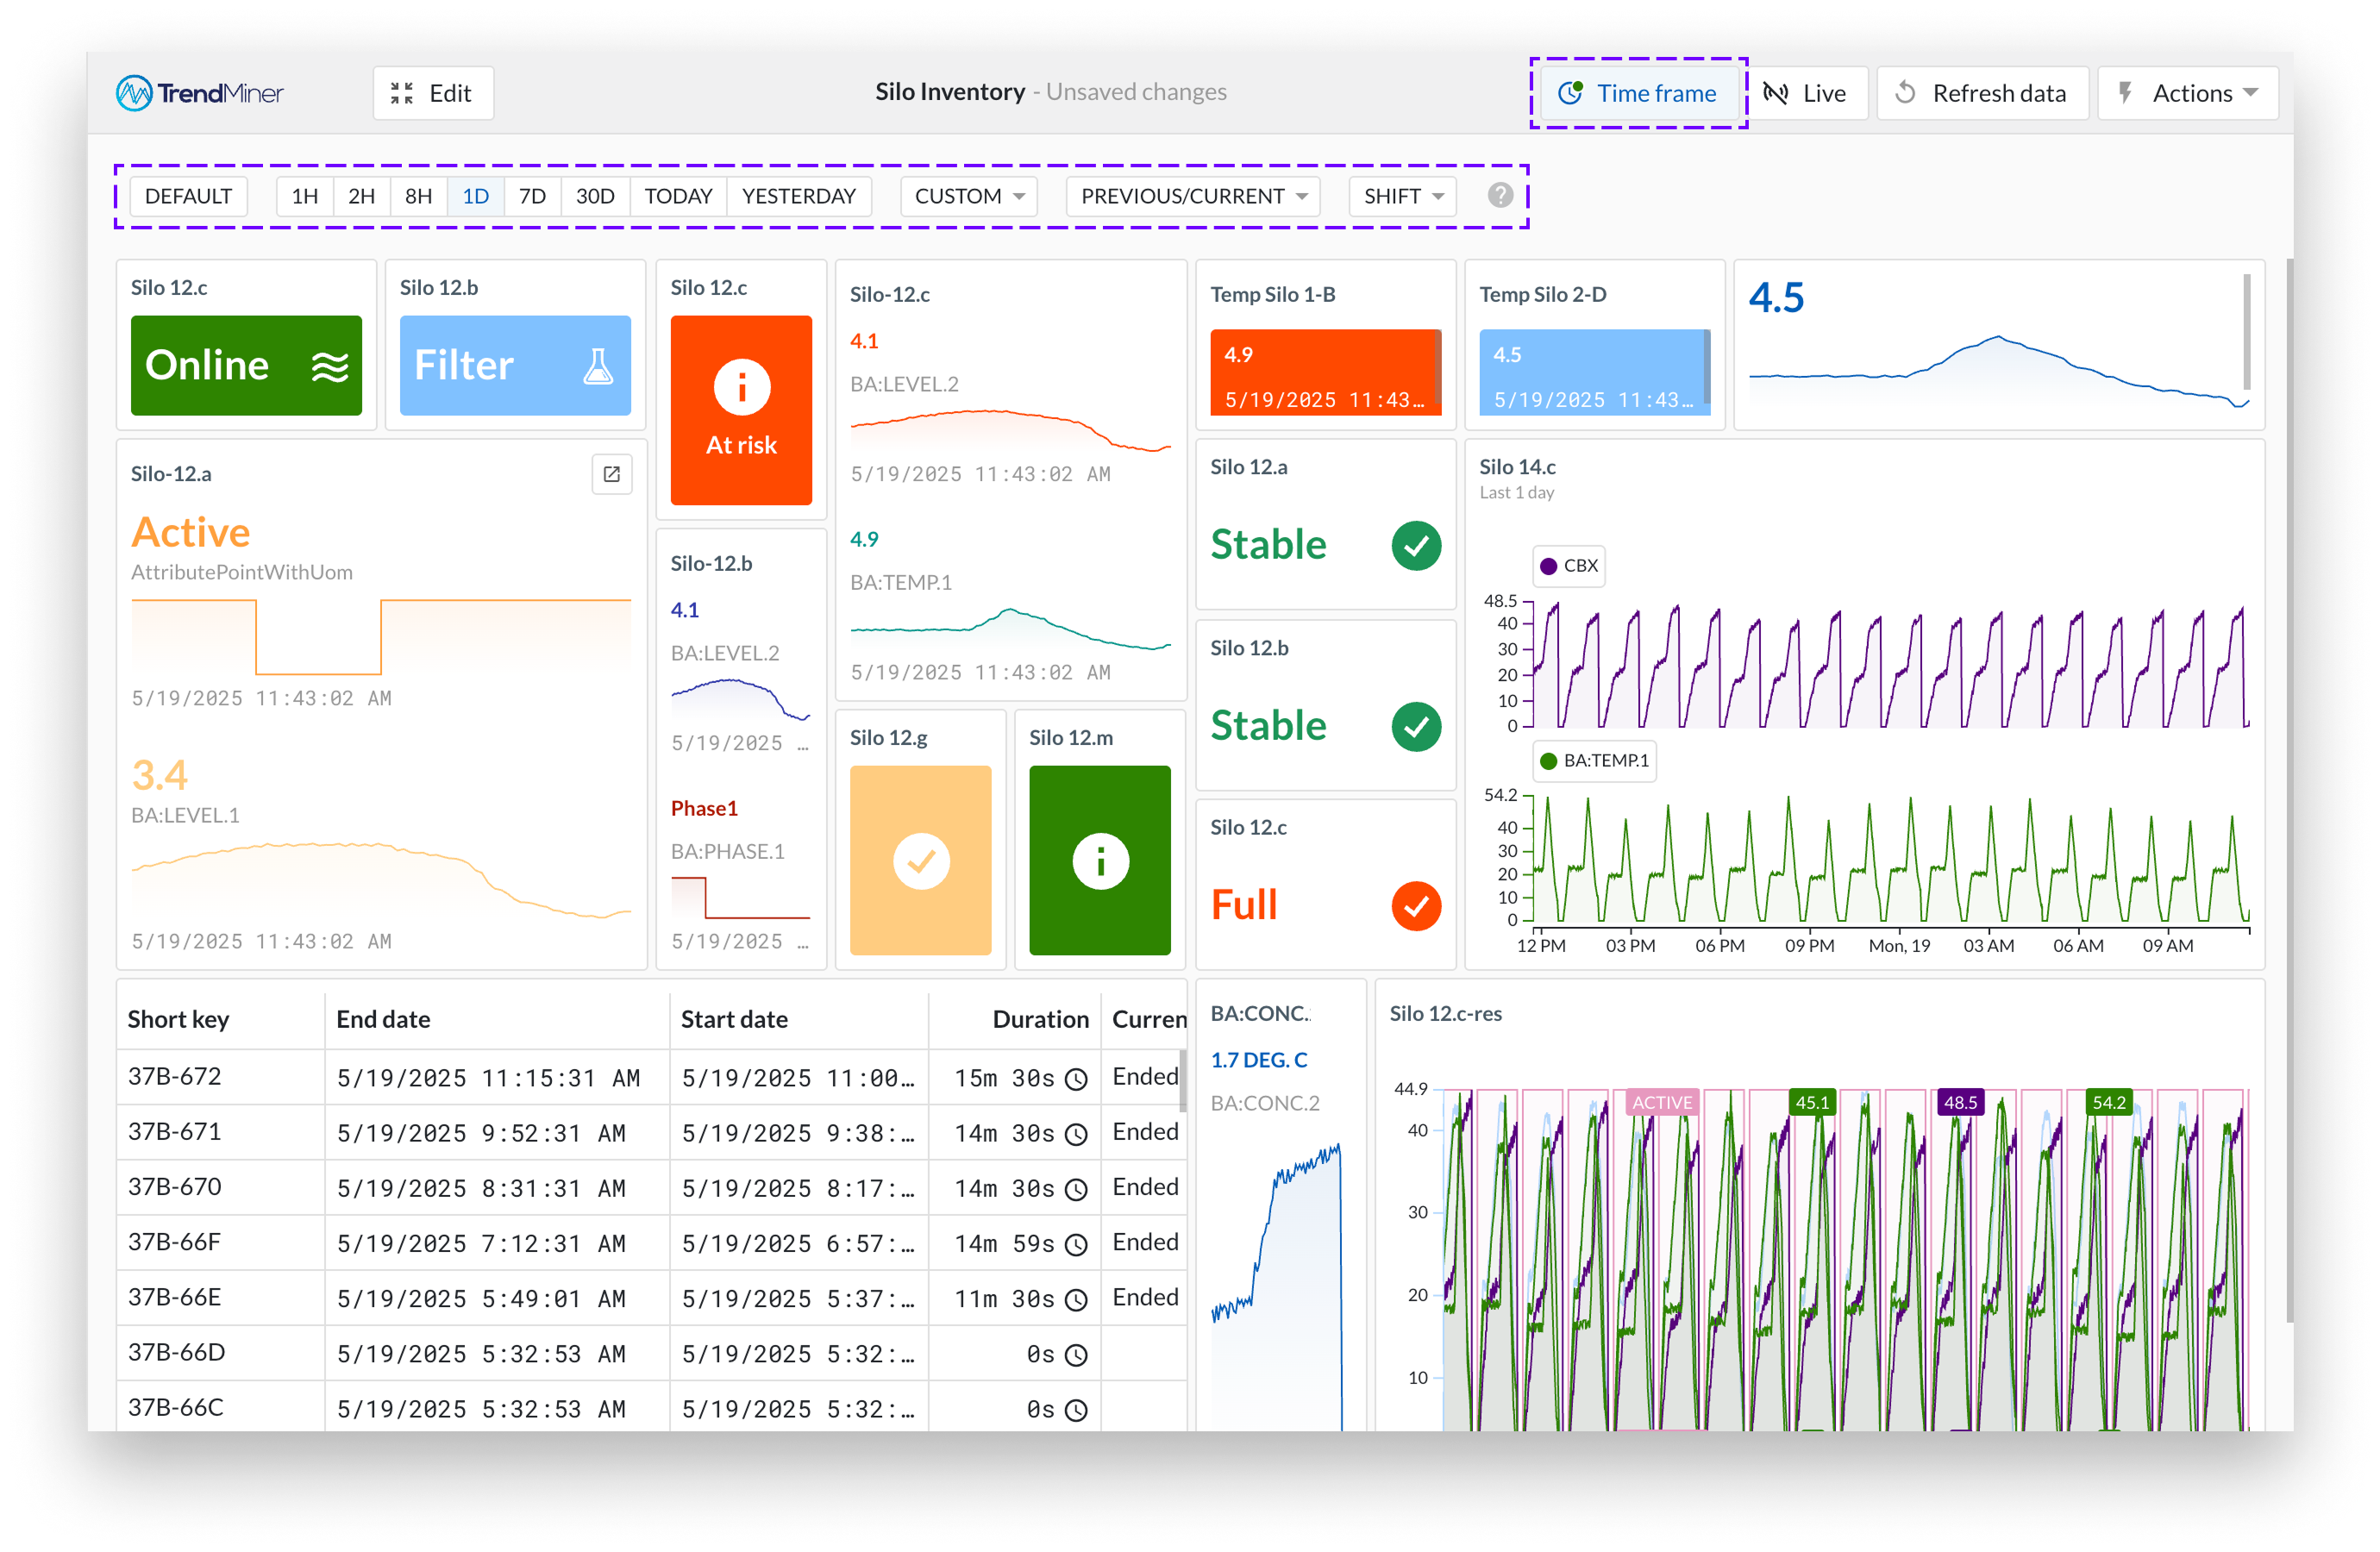
The global time frame feature allows you to set a single time context for all tiles on a dashboard. When a time frame is selected, it is applied uniformly across every tile, keeping the entire dashboard synchronized. You can access the global time frame settings by clicking the time frame button.
Once selected, the chosen time frame takes effect immediately and updates the view for all dashboard tiles.
Quick Selections
A set of predefined time ranges is available for fast selection: 1H, 2H, 8H, 1D, 30D, TODAY, and YESTERDAY
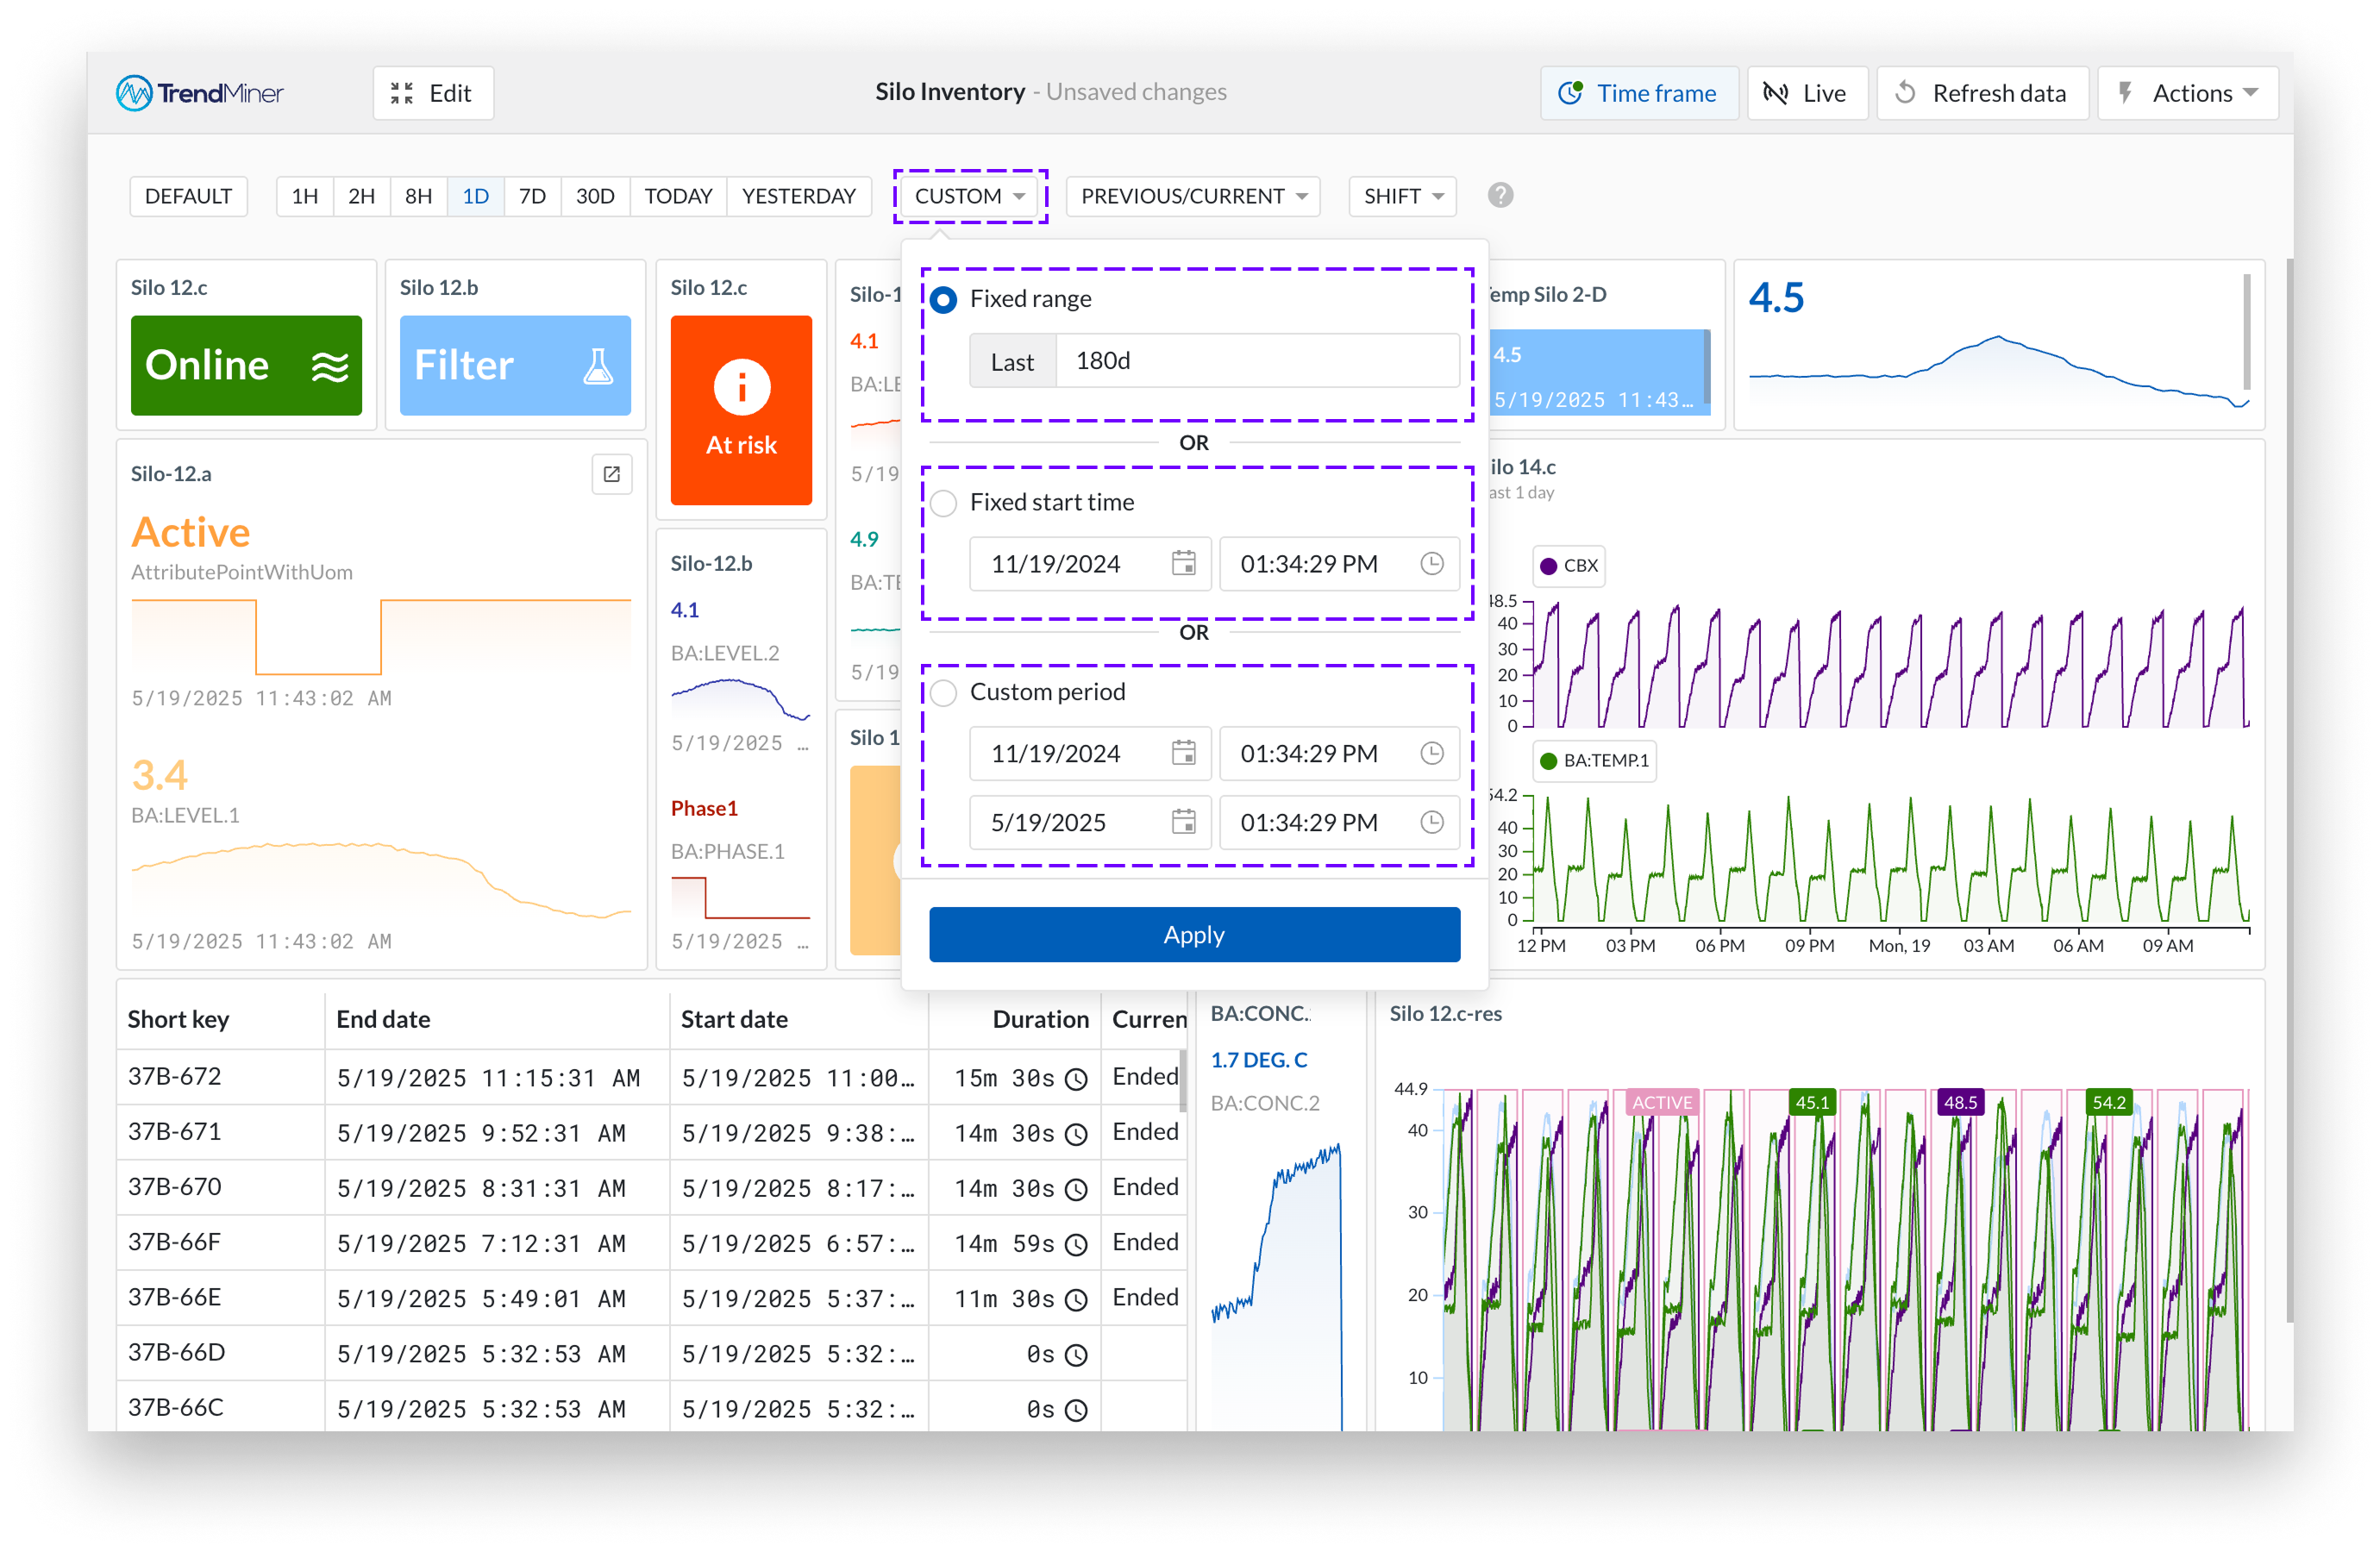
Custom Time Frames
For more specific needs, open the CUSTOM tab. Here you can define a personalized time range by choosing from:
Fixed range, where both start and end times are defined.
Fixed start time, where the start is fixed and the end updates dynamically.
Custom period, a fully flexible time window.
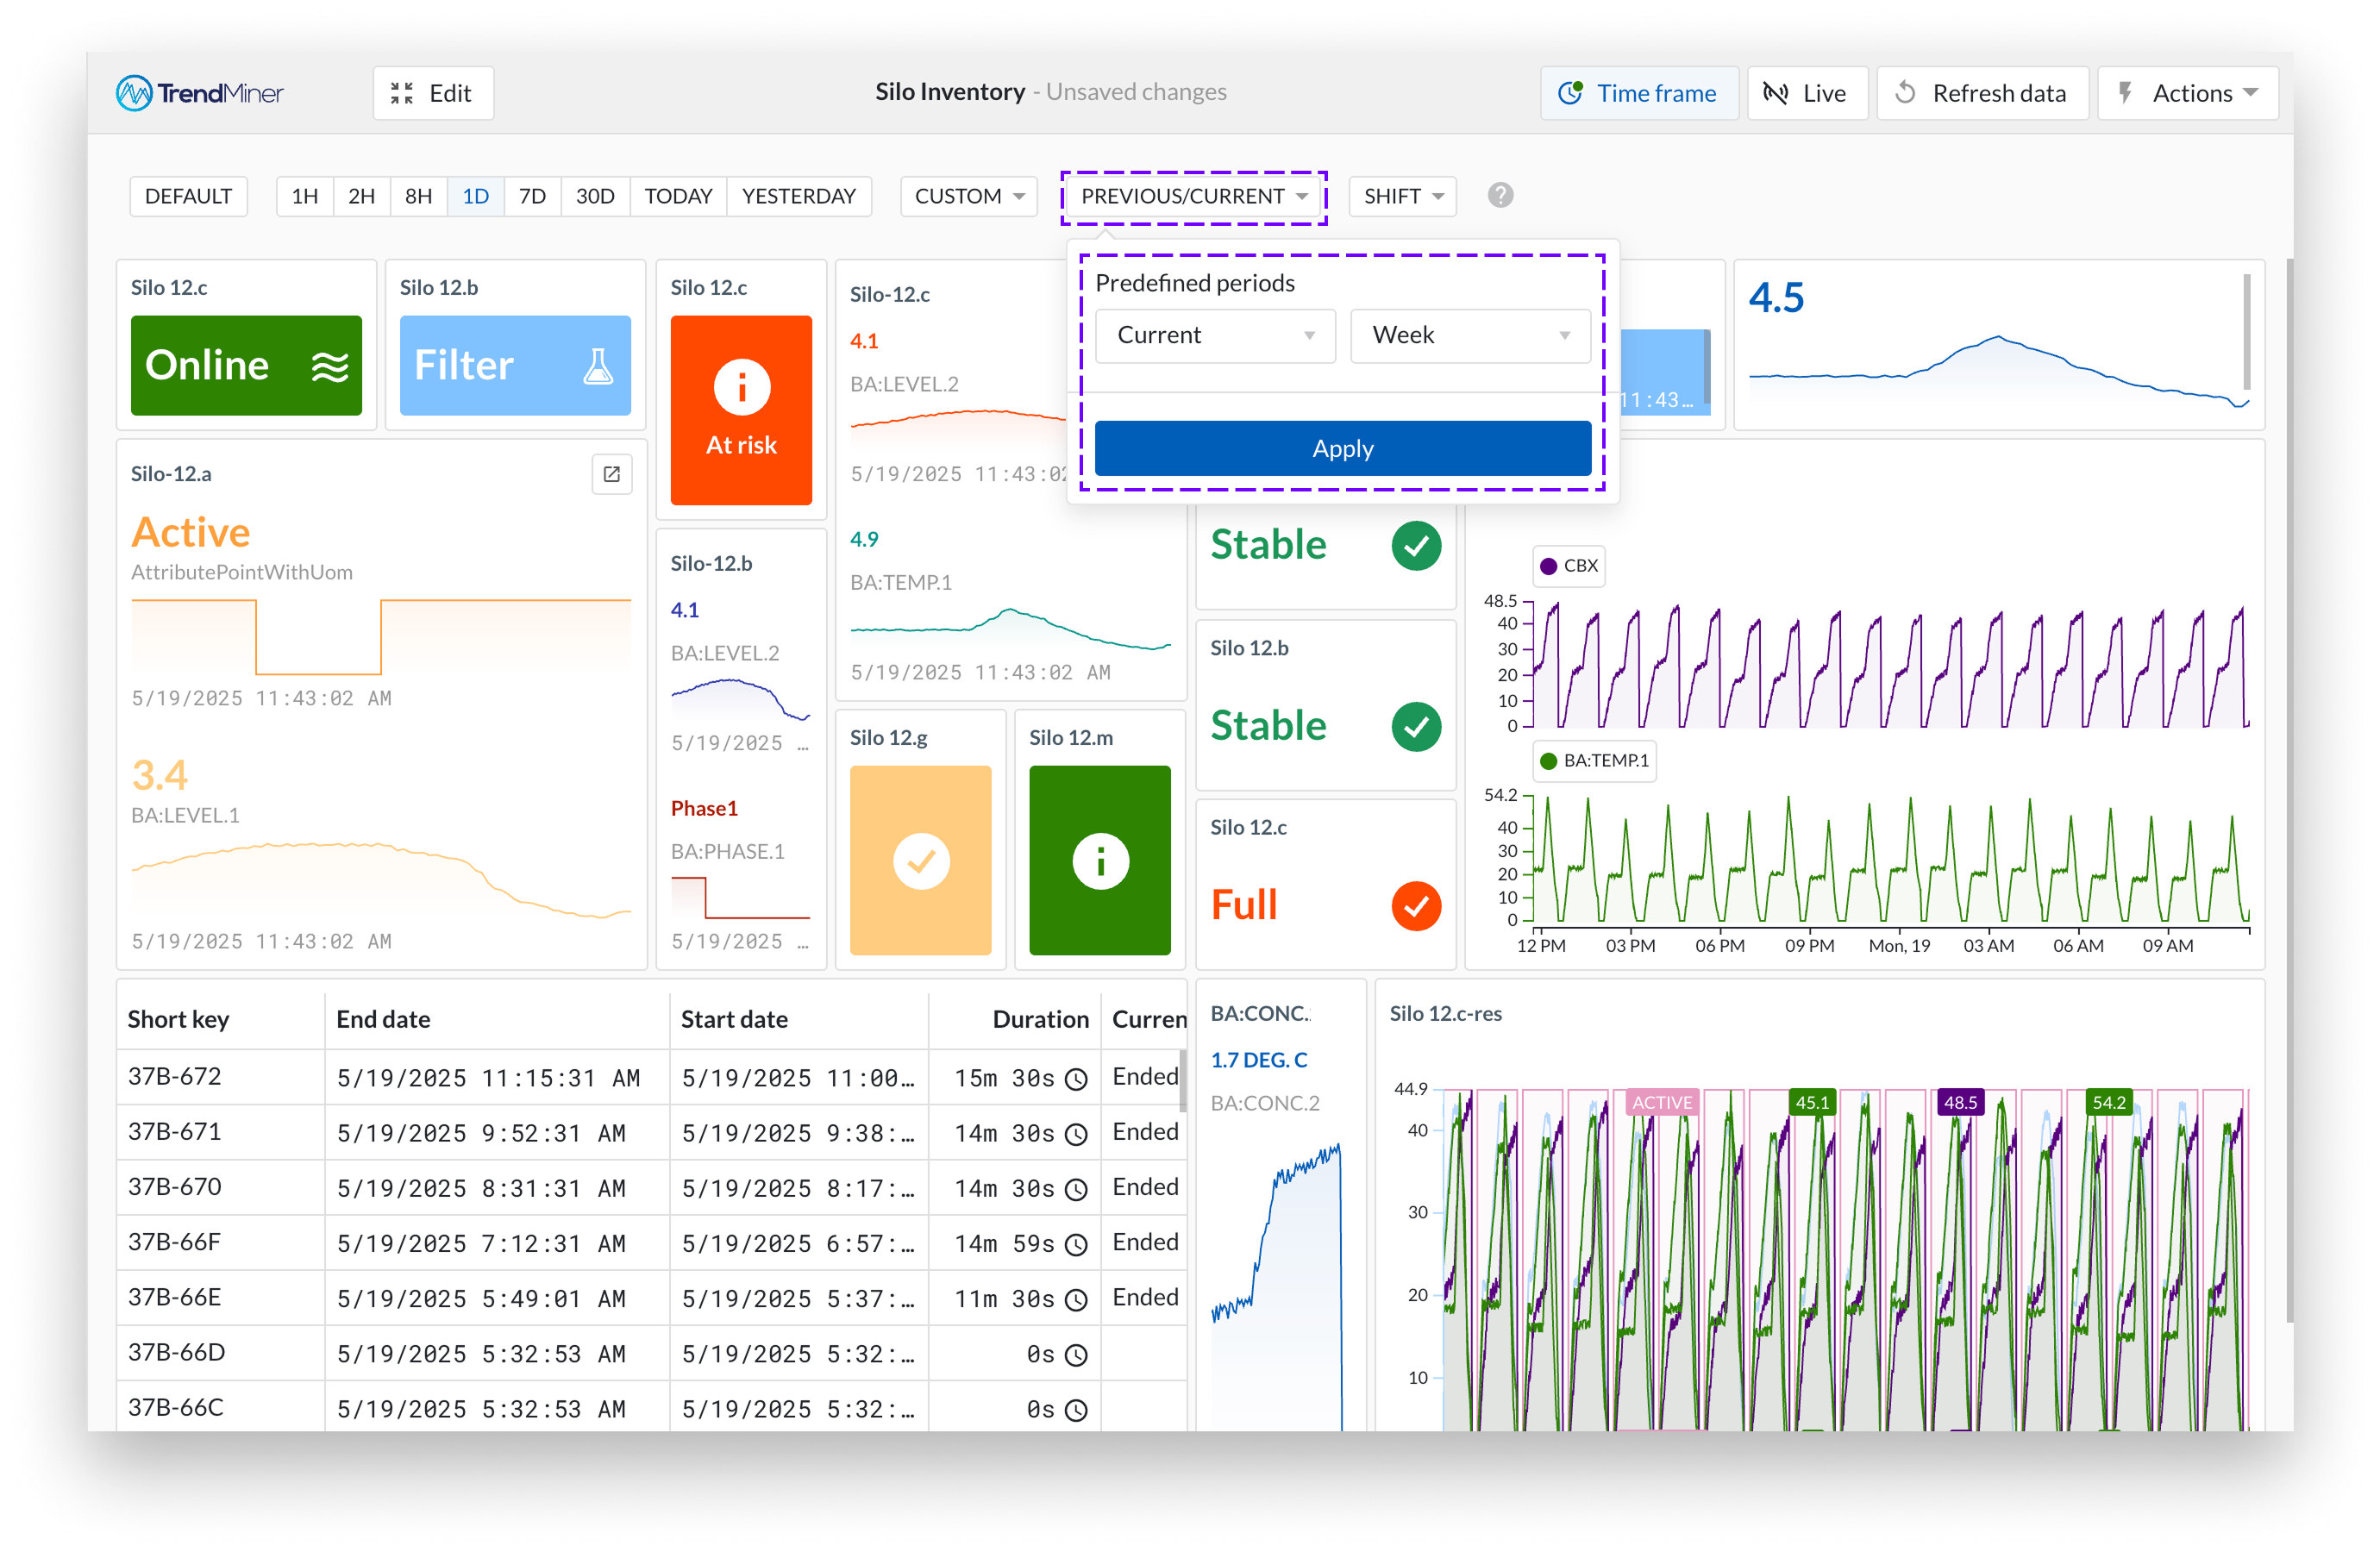
Predefined Previous or Current Periods
The PREVIOUS/CURRENT tab provides calendar-based options, letting you select from: Workweek, Week, Month, or Year, either as the current or the previous period.
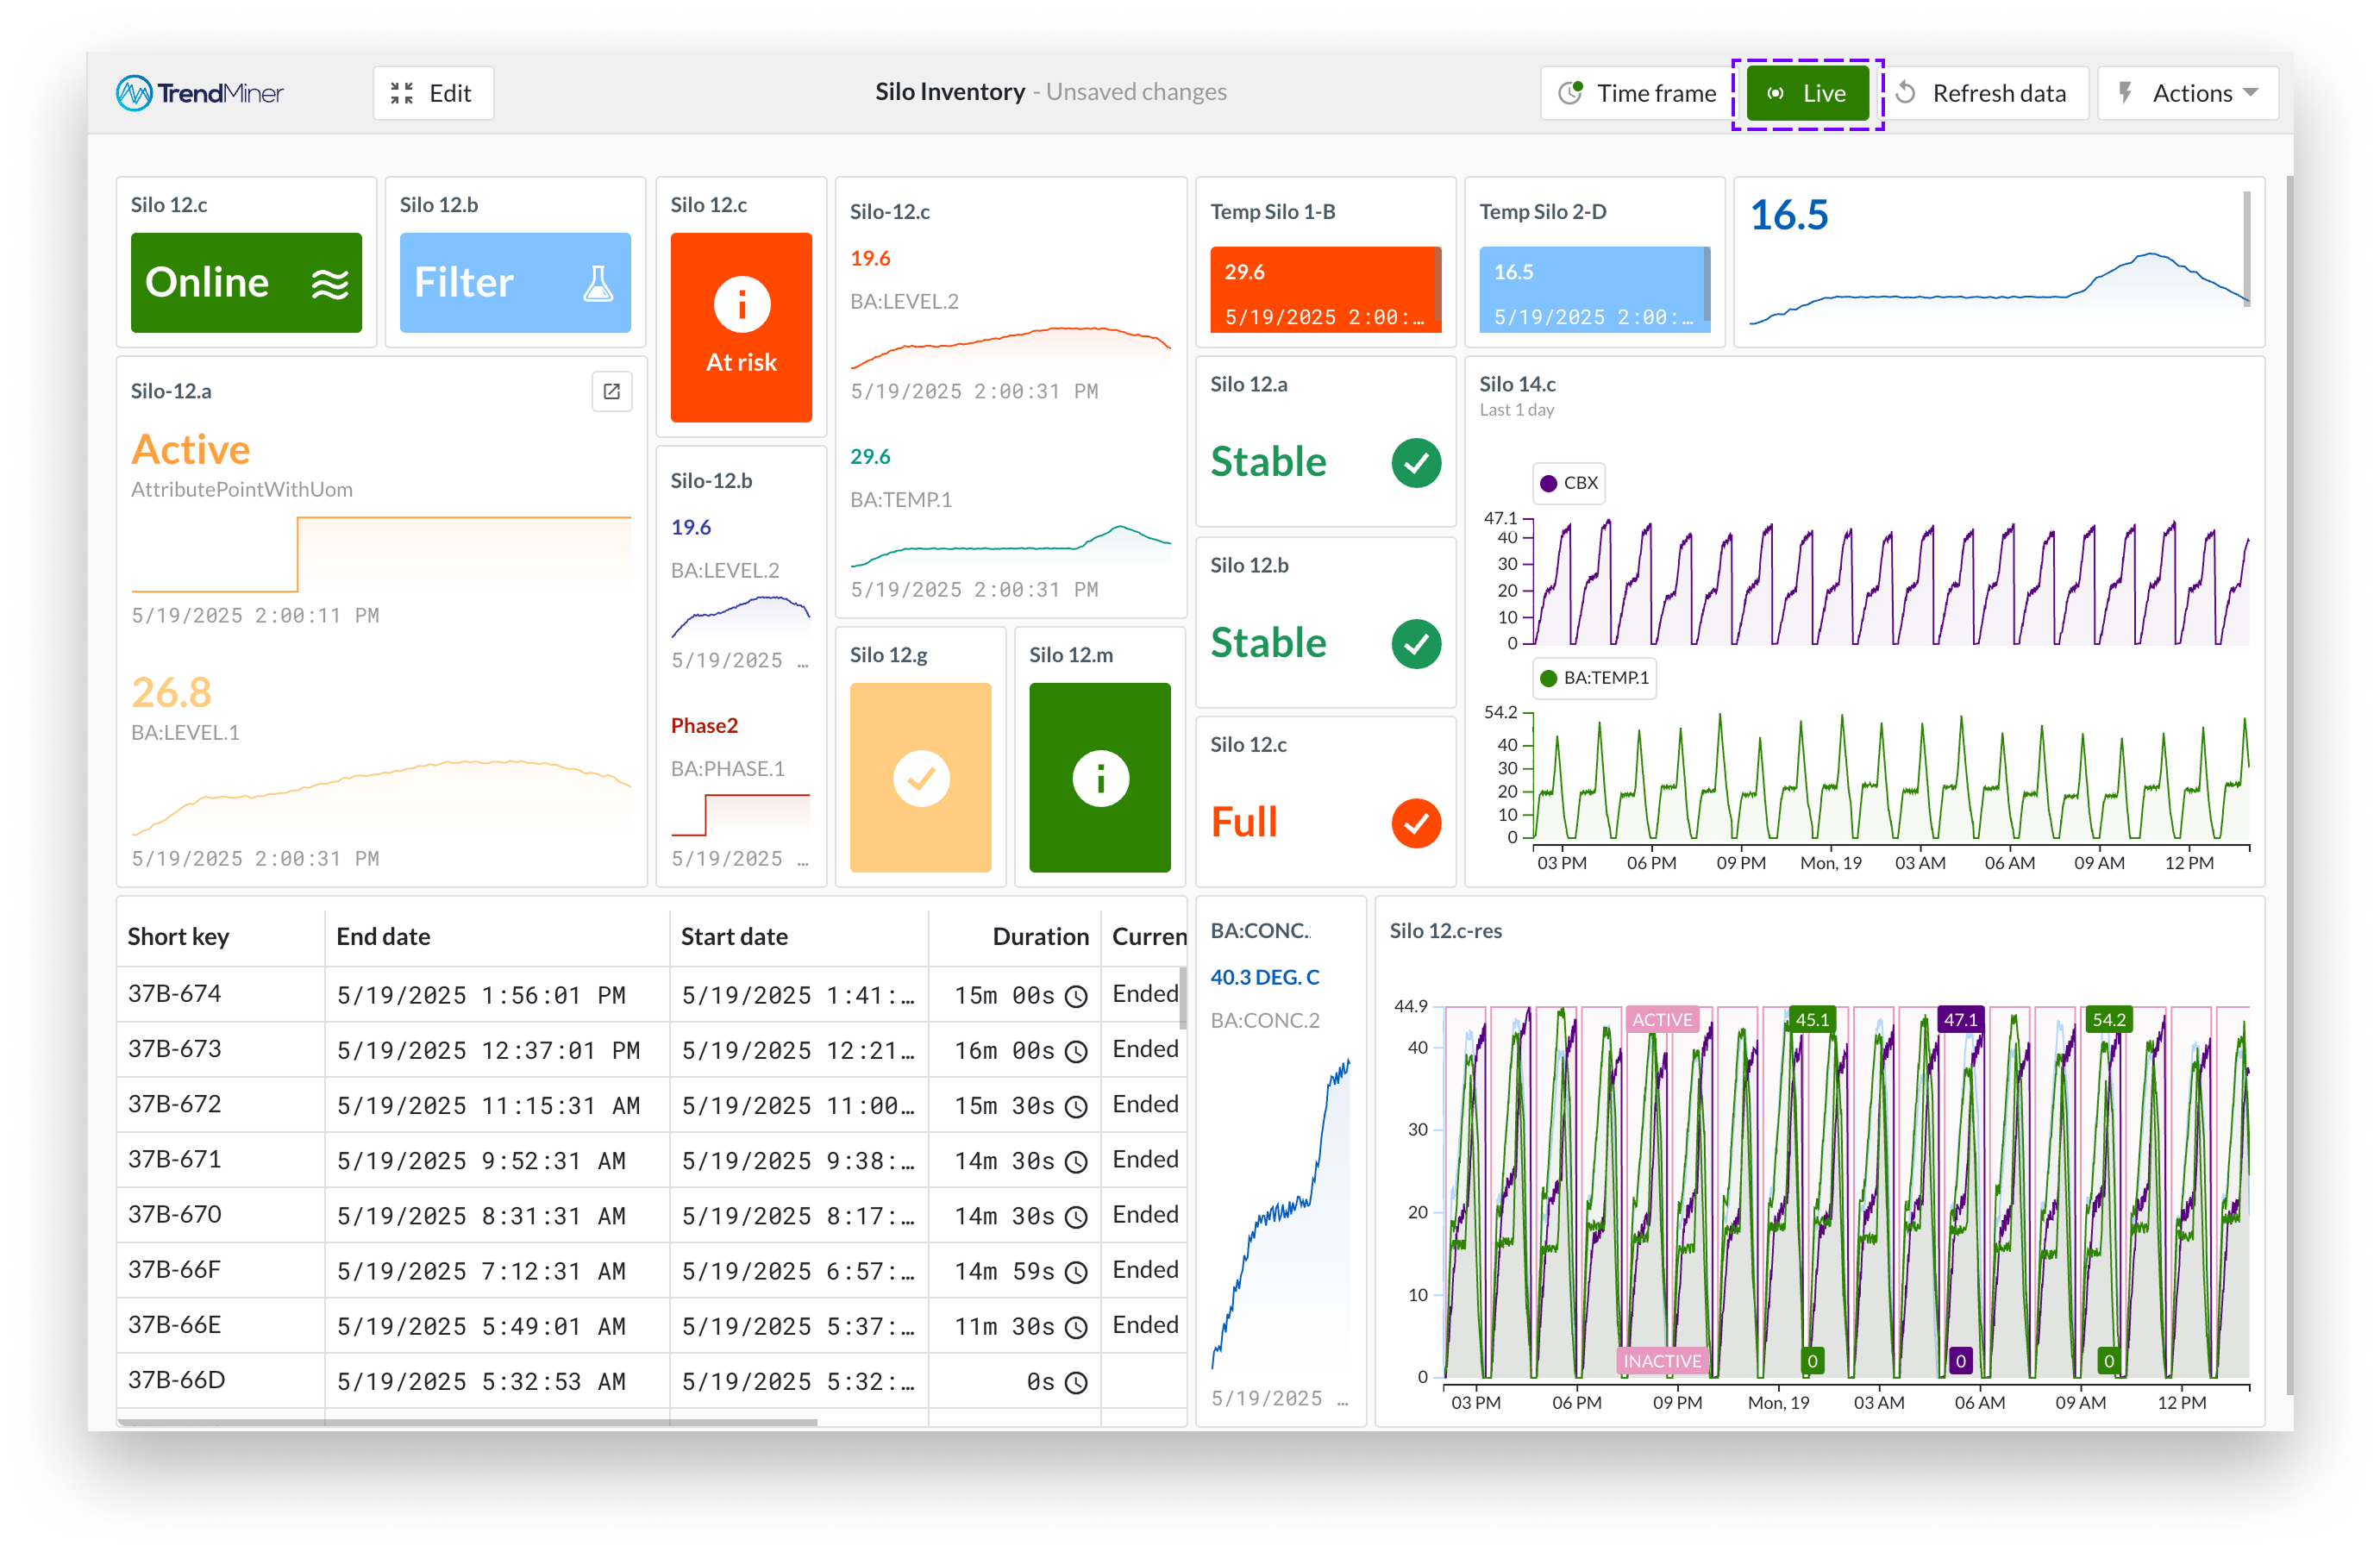
Live mode is a setting that keeps dashboard tiles continuously updated with the latest data. When enabled, tiles automatically refresh at a configurable interval, providing real-time insights without the need for manual updates.
You can enable live mode by toggling the Live mode switch located in the top bar of the dashboard. Once activated, the dashboard will begin refreshing tiles based on their configured intervals.
Live mode is saved as part of the dashboard settings, so your preference is retained each time the dashboard is opened.
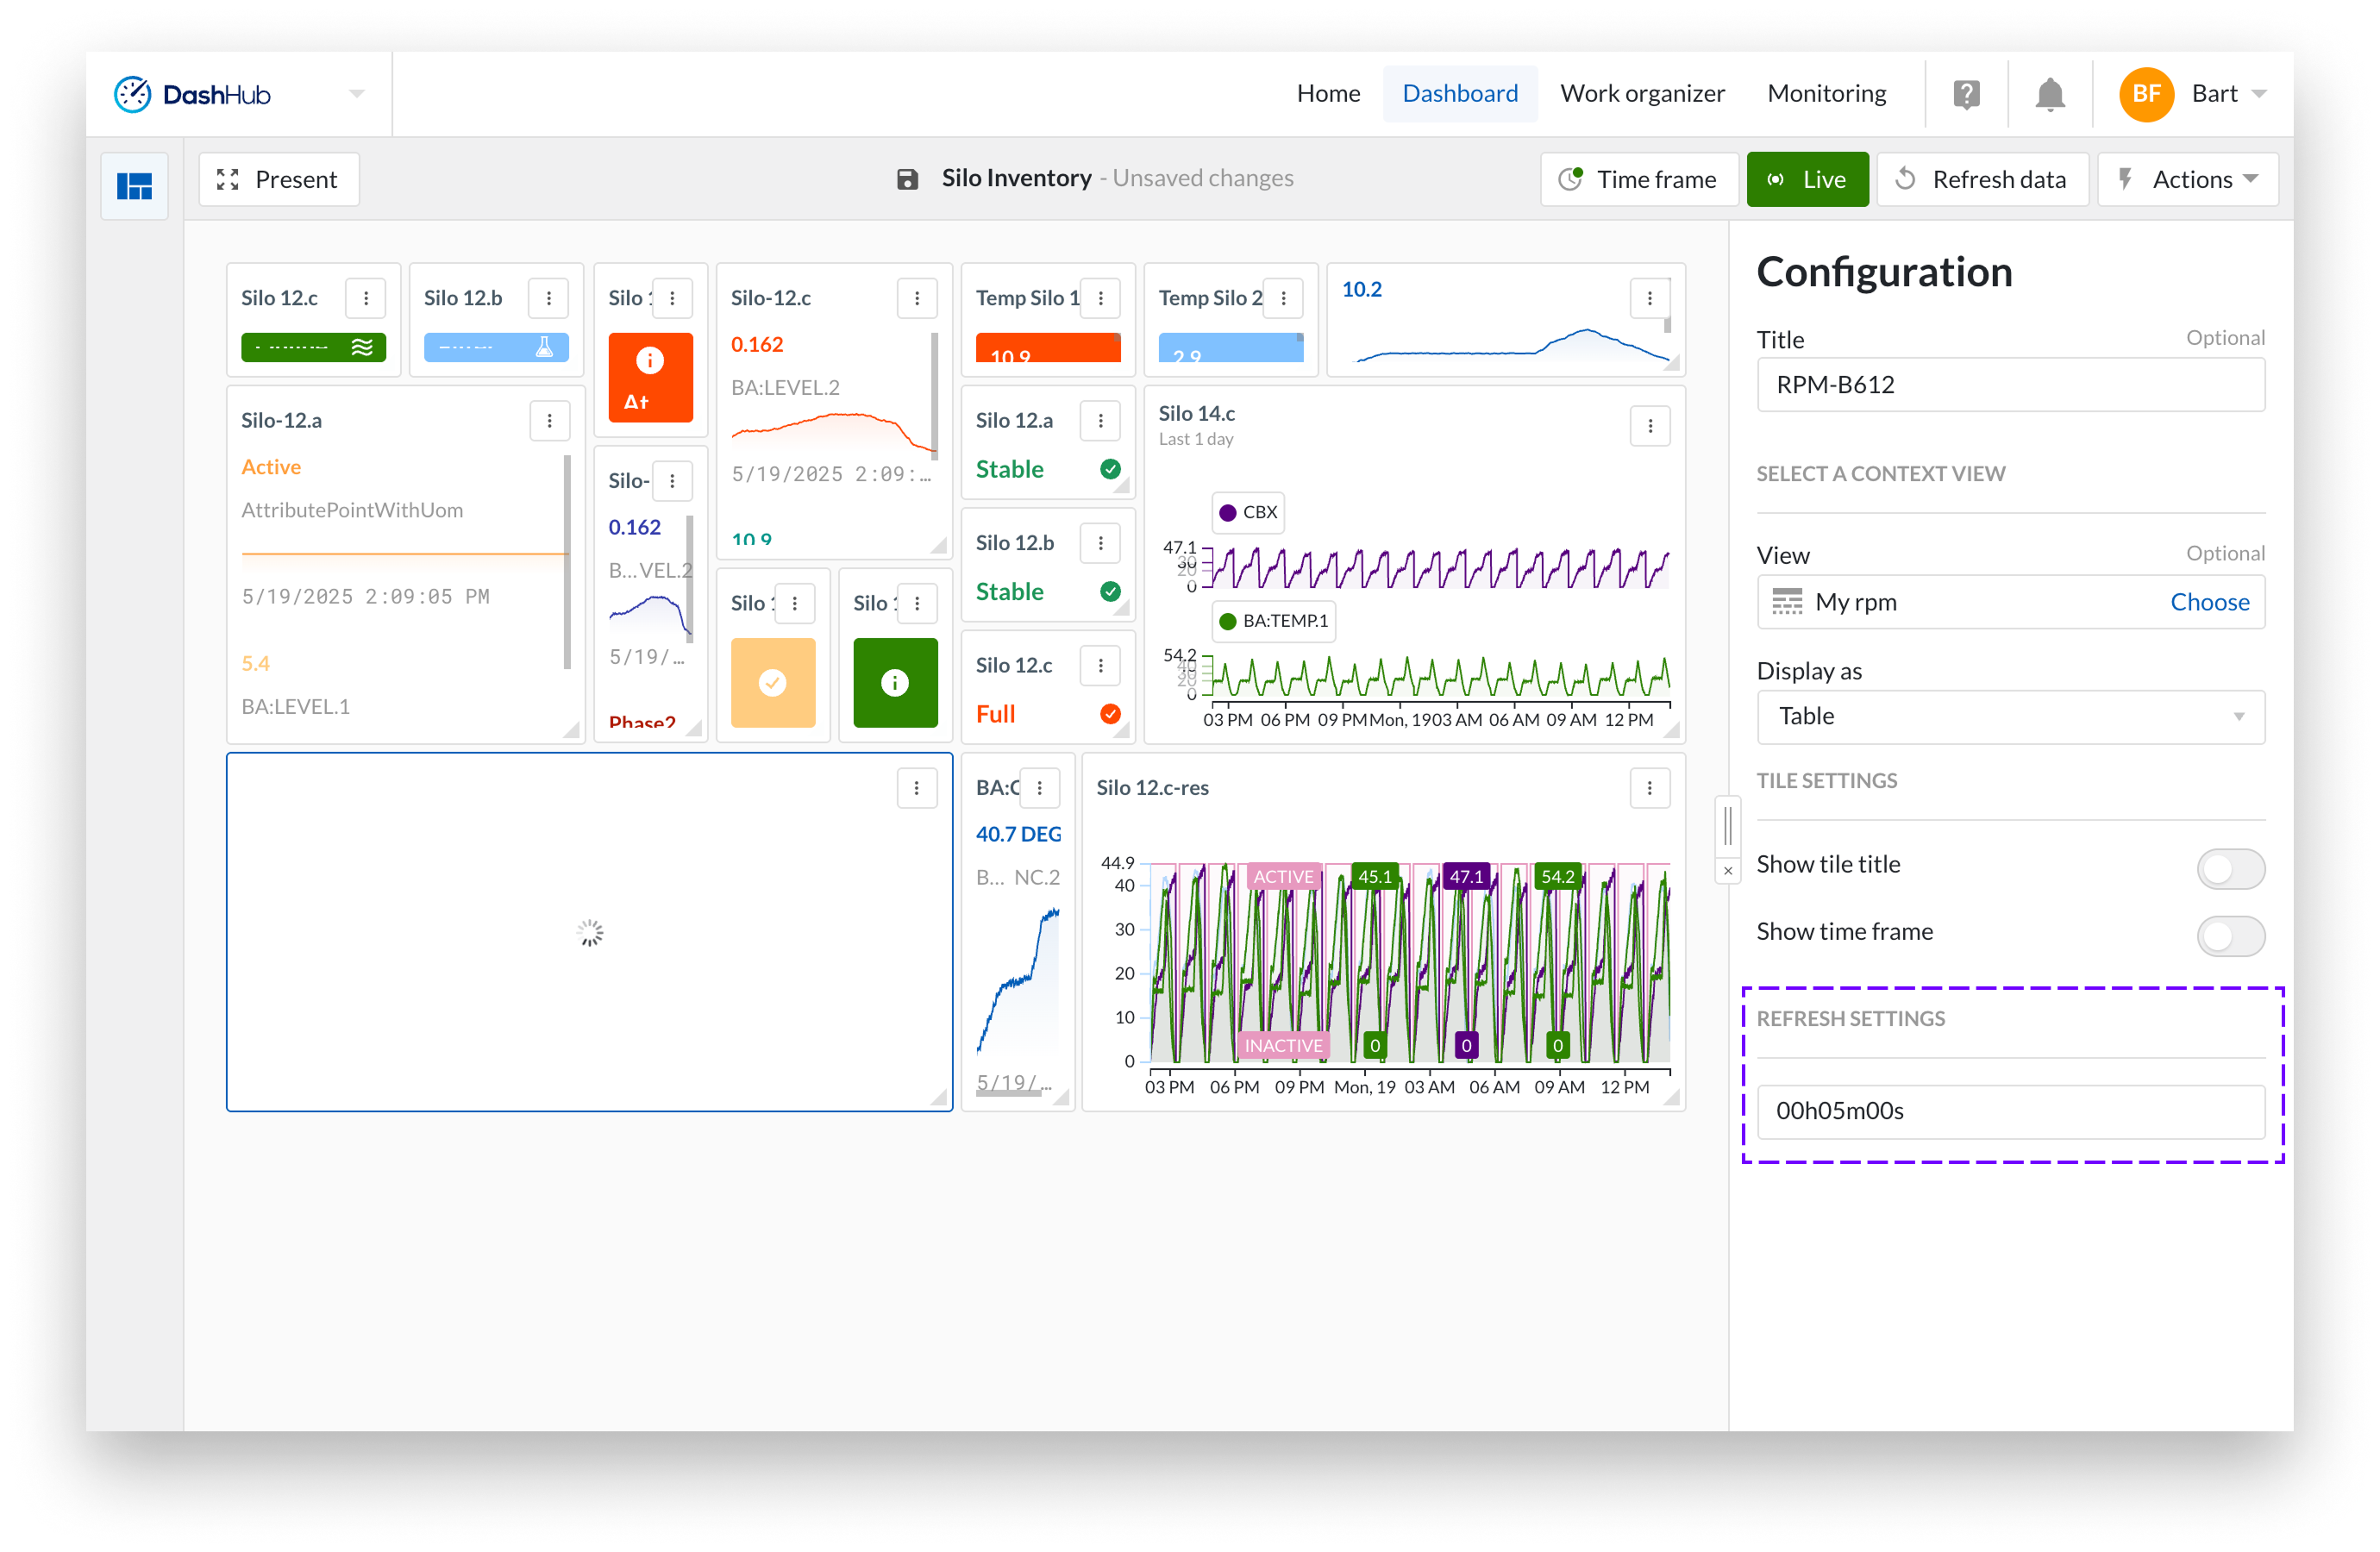
Refresh settings
The refresh rate for each tile can be configured individually under the refresh settings. By default, the context view tile and the TrendHub view tile refresh every 5 minutes, while the monitor tile and the current value tile refresh every 1 minute.
Note
For Context view tiles to update correctly in live mode, the selected time frame must include the event open setting with no end date configured. If an end date is set, the tile will not refresh with live data because the current time falls outside the specified date range.
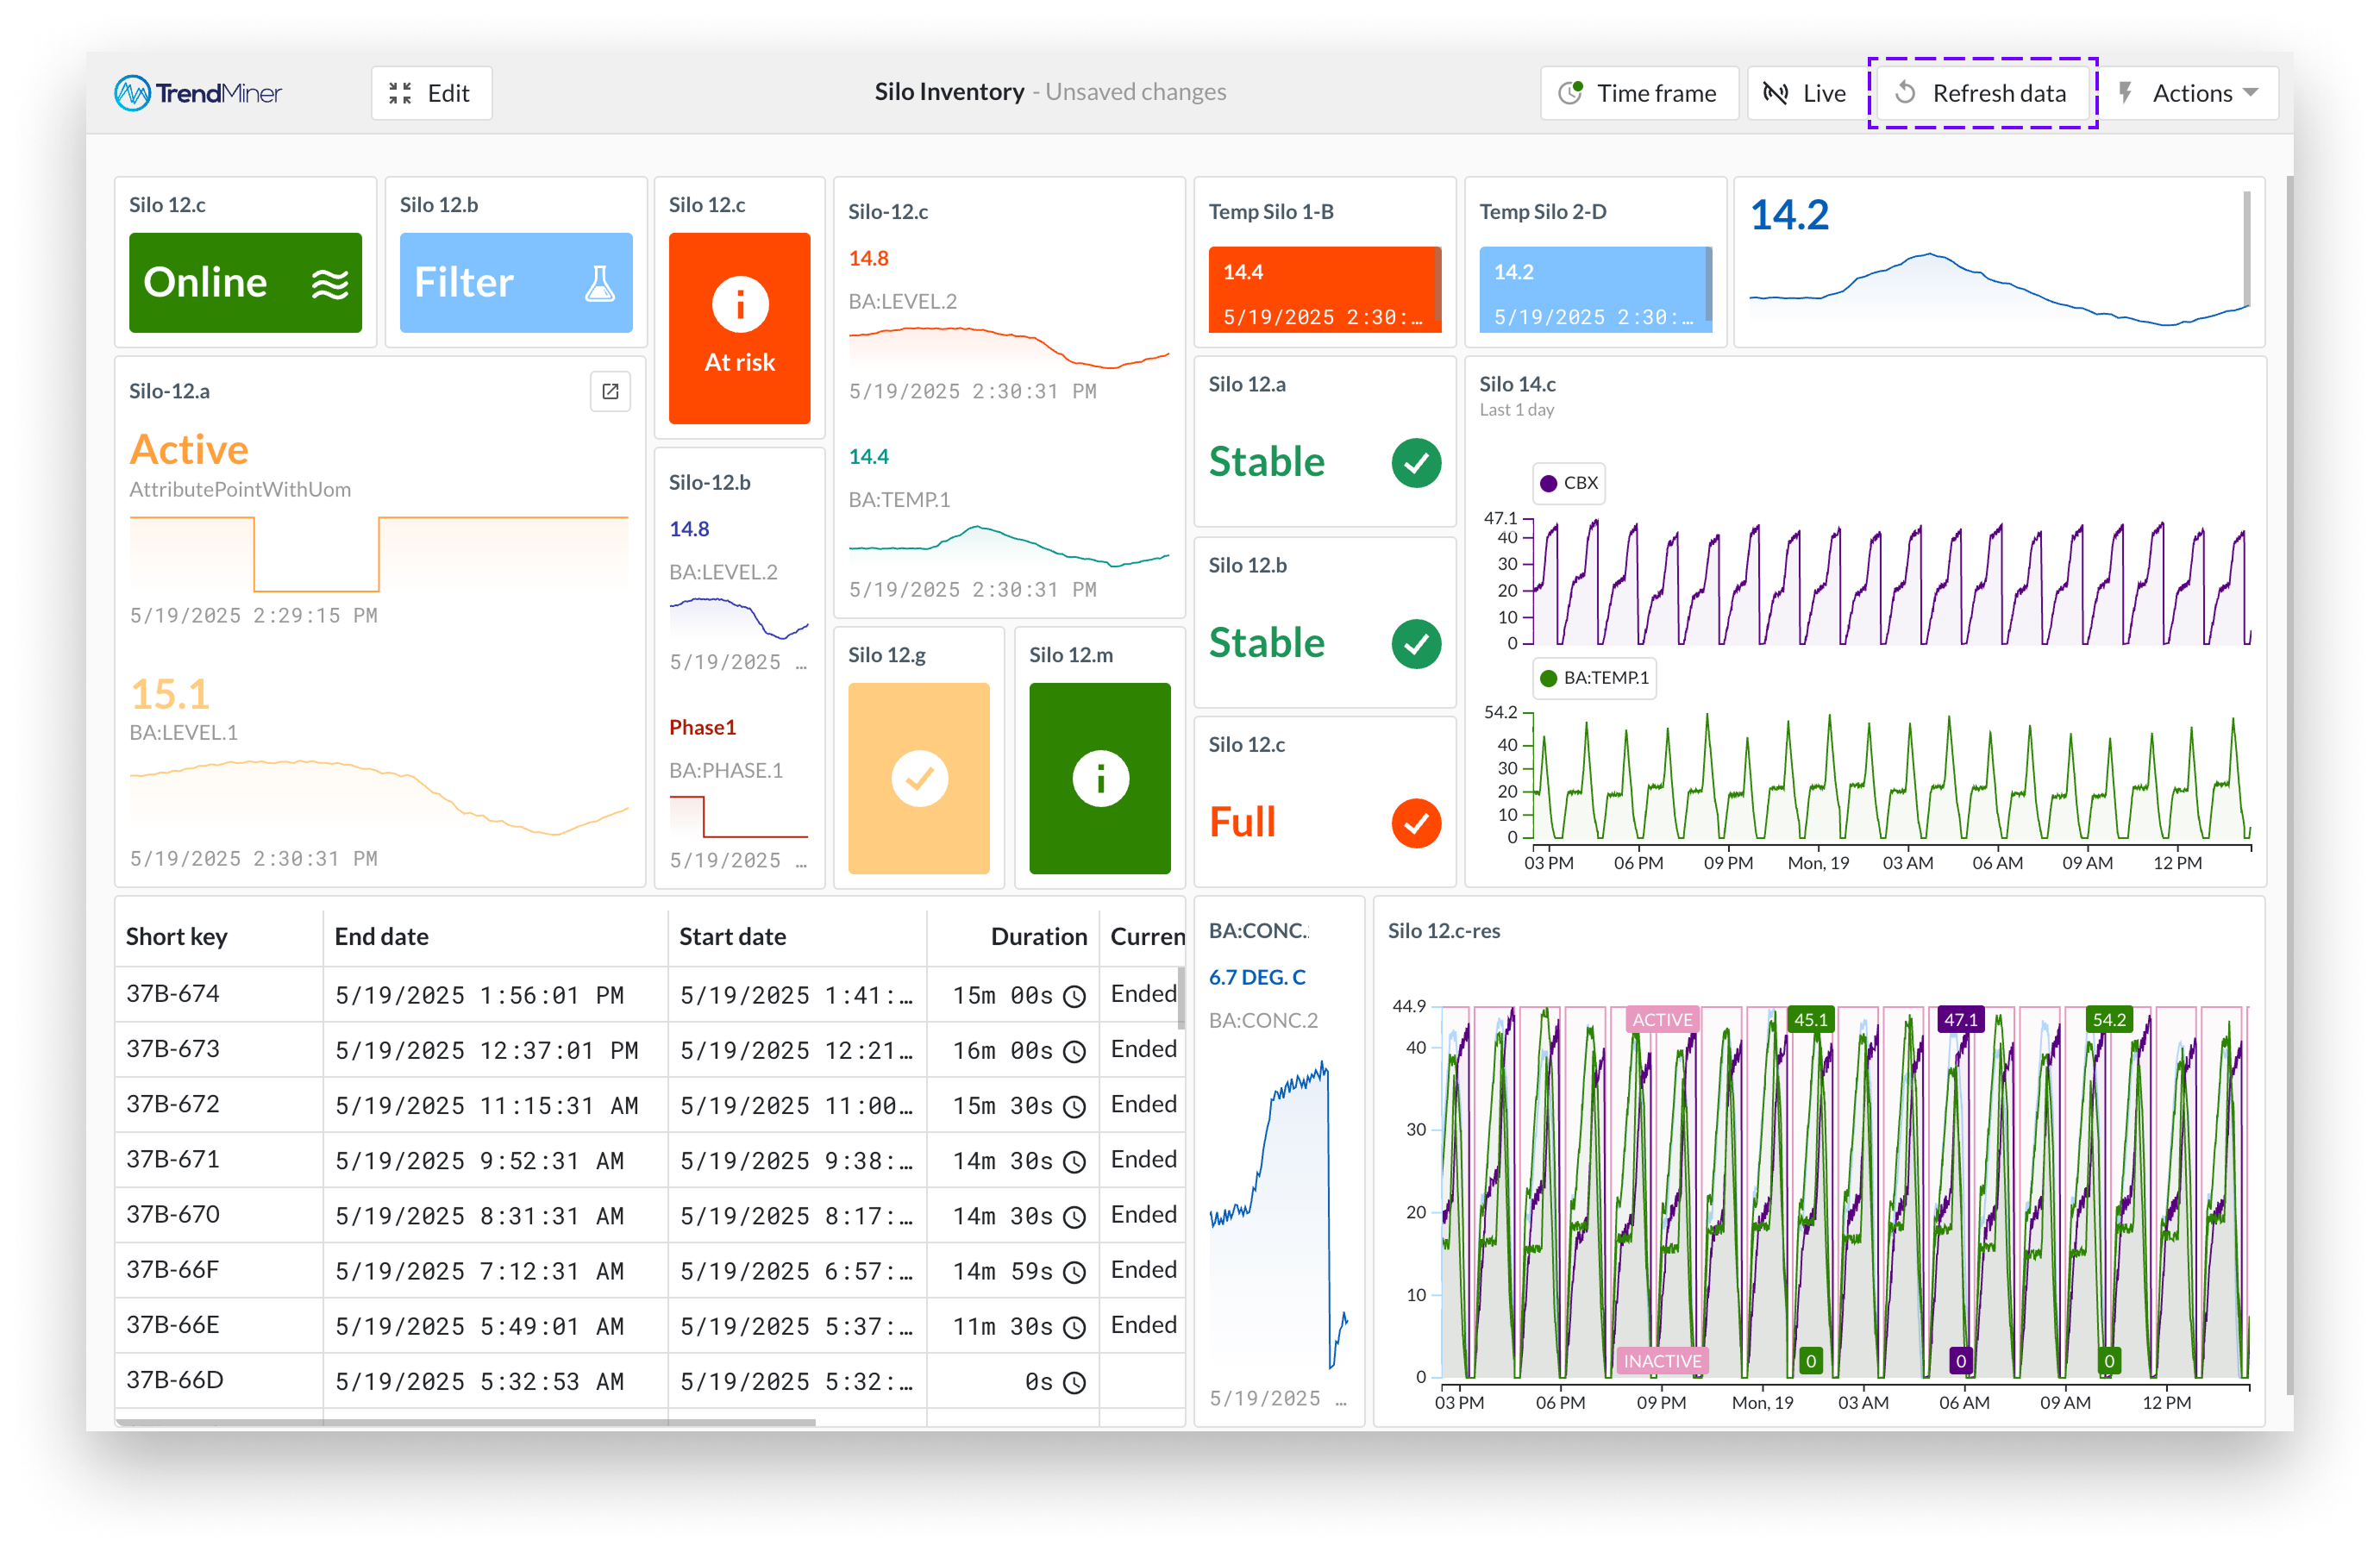
The Refresh data button lets you manually update the data shown on all tiles in your dashboard at once. It refreshes the tile content but does not affect any settings. This button is available in the top bar.
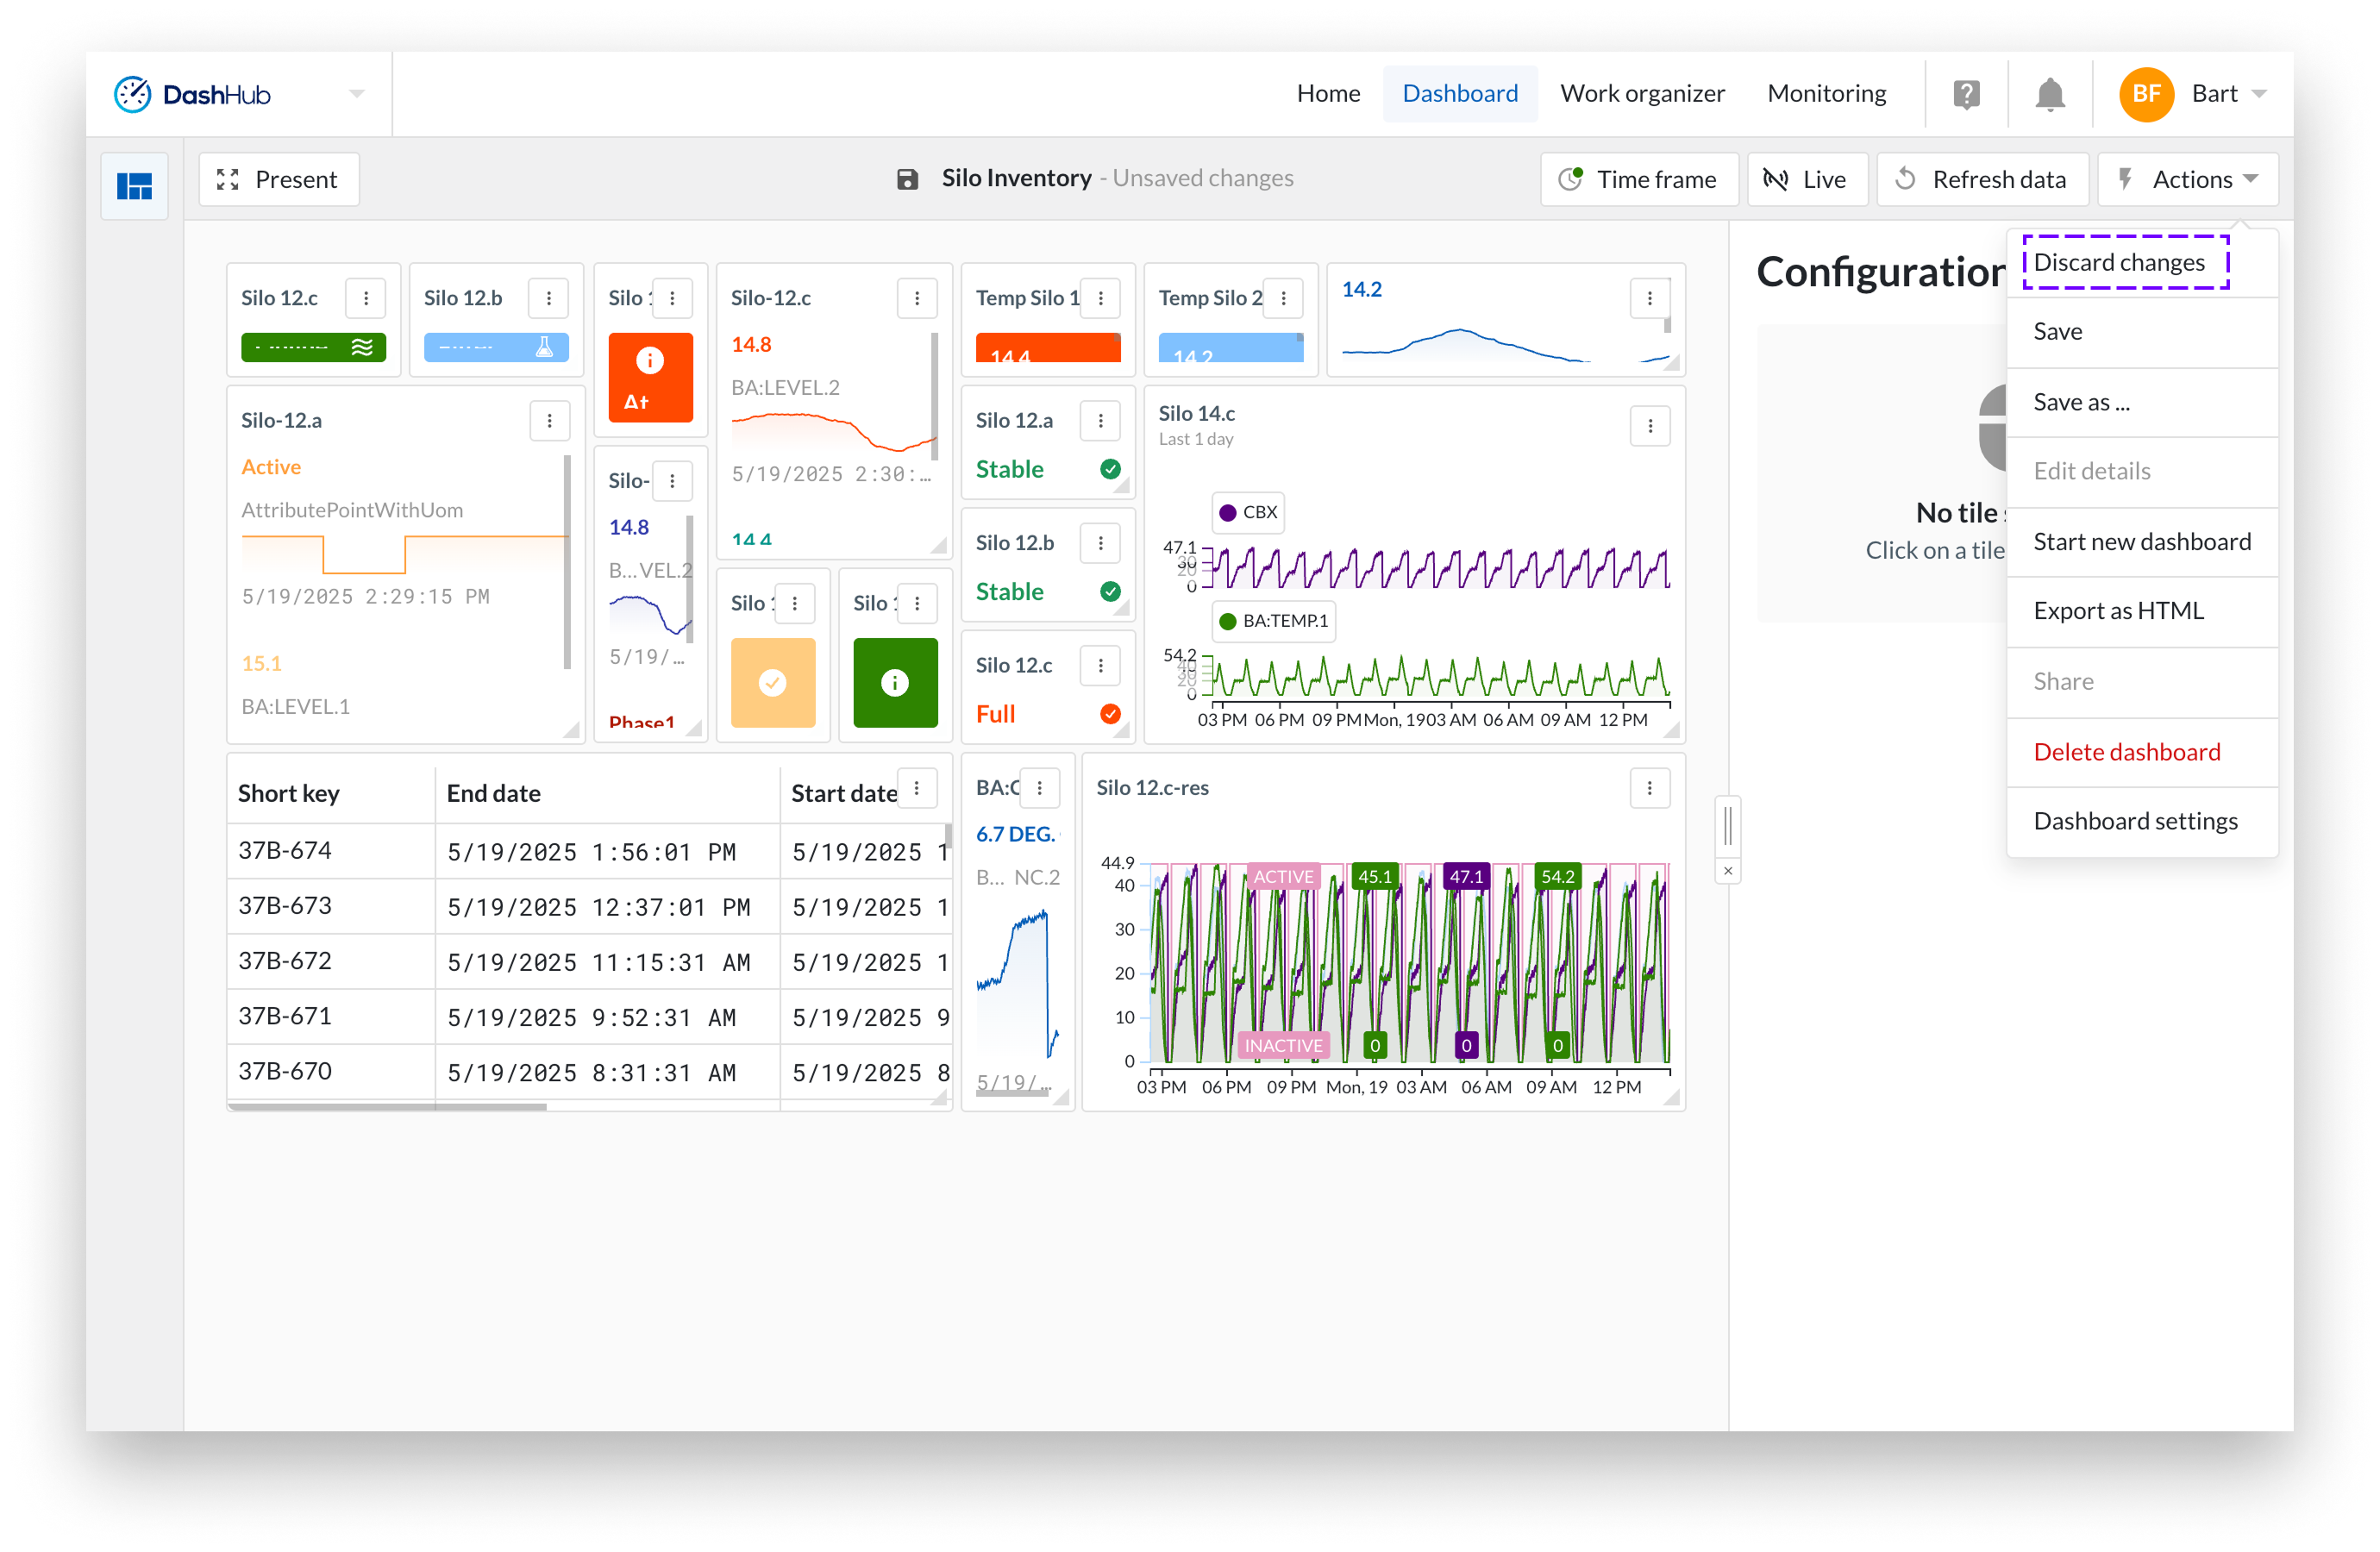
The Discard changes option is available in the actions menu and reverts all unsaved changes made since the last time you saved the dashboard.
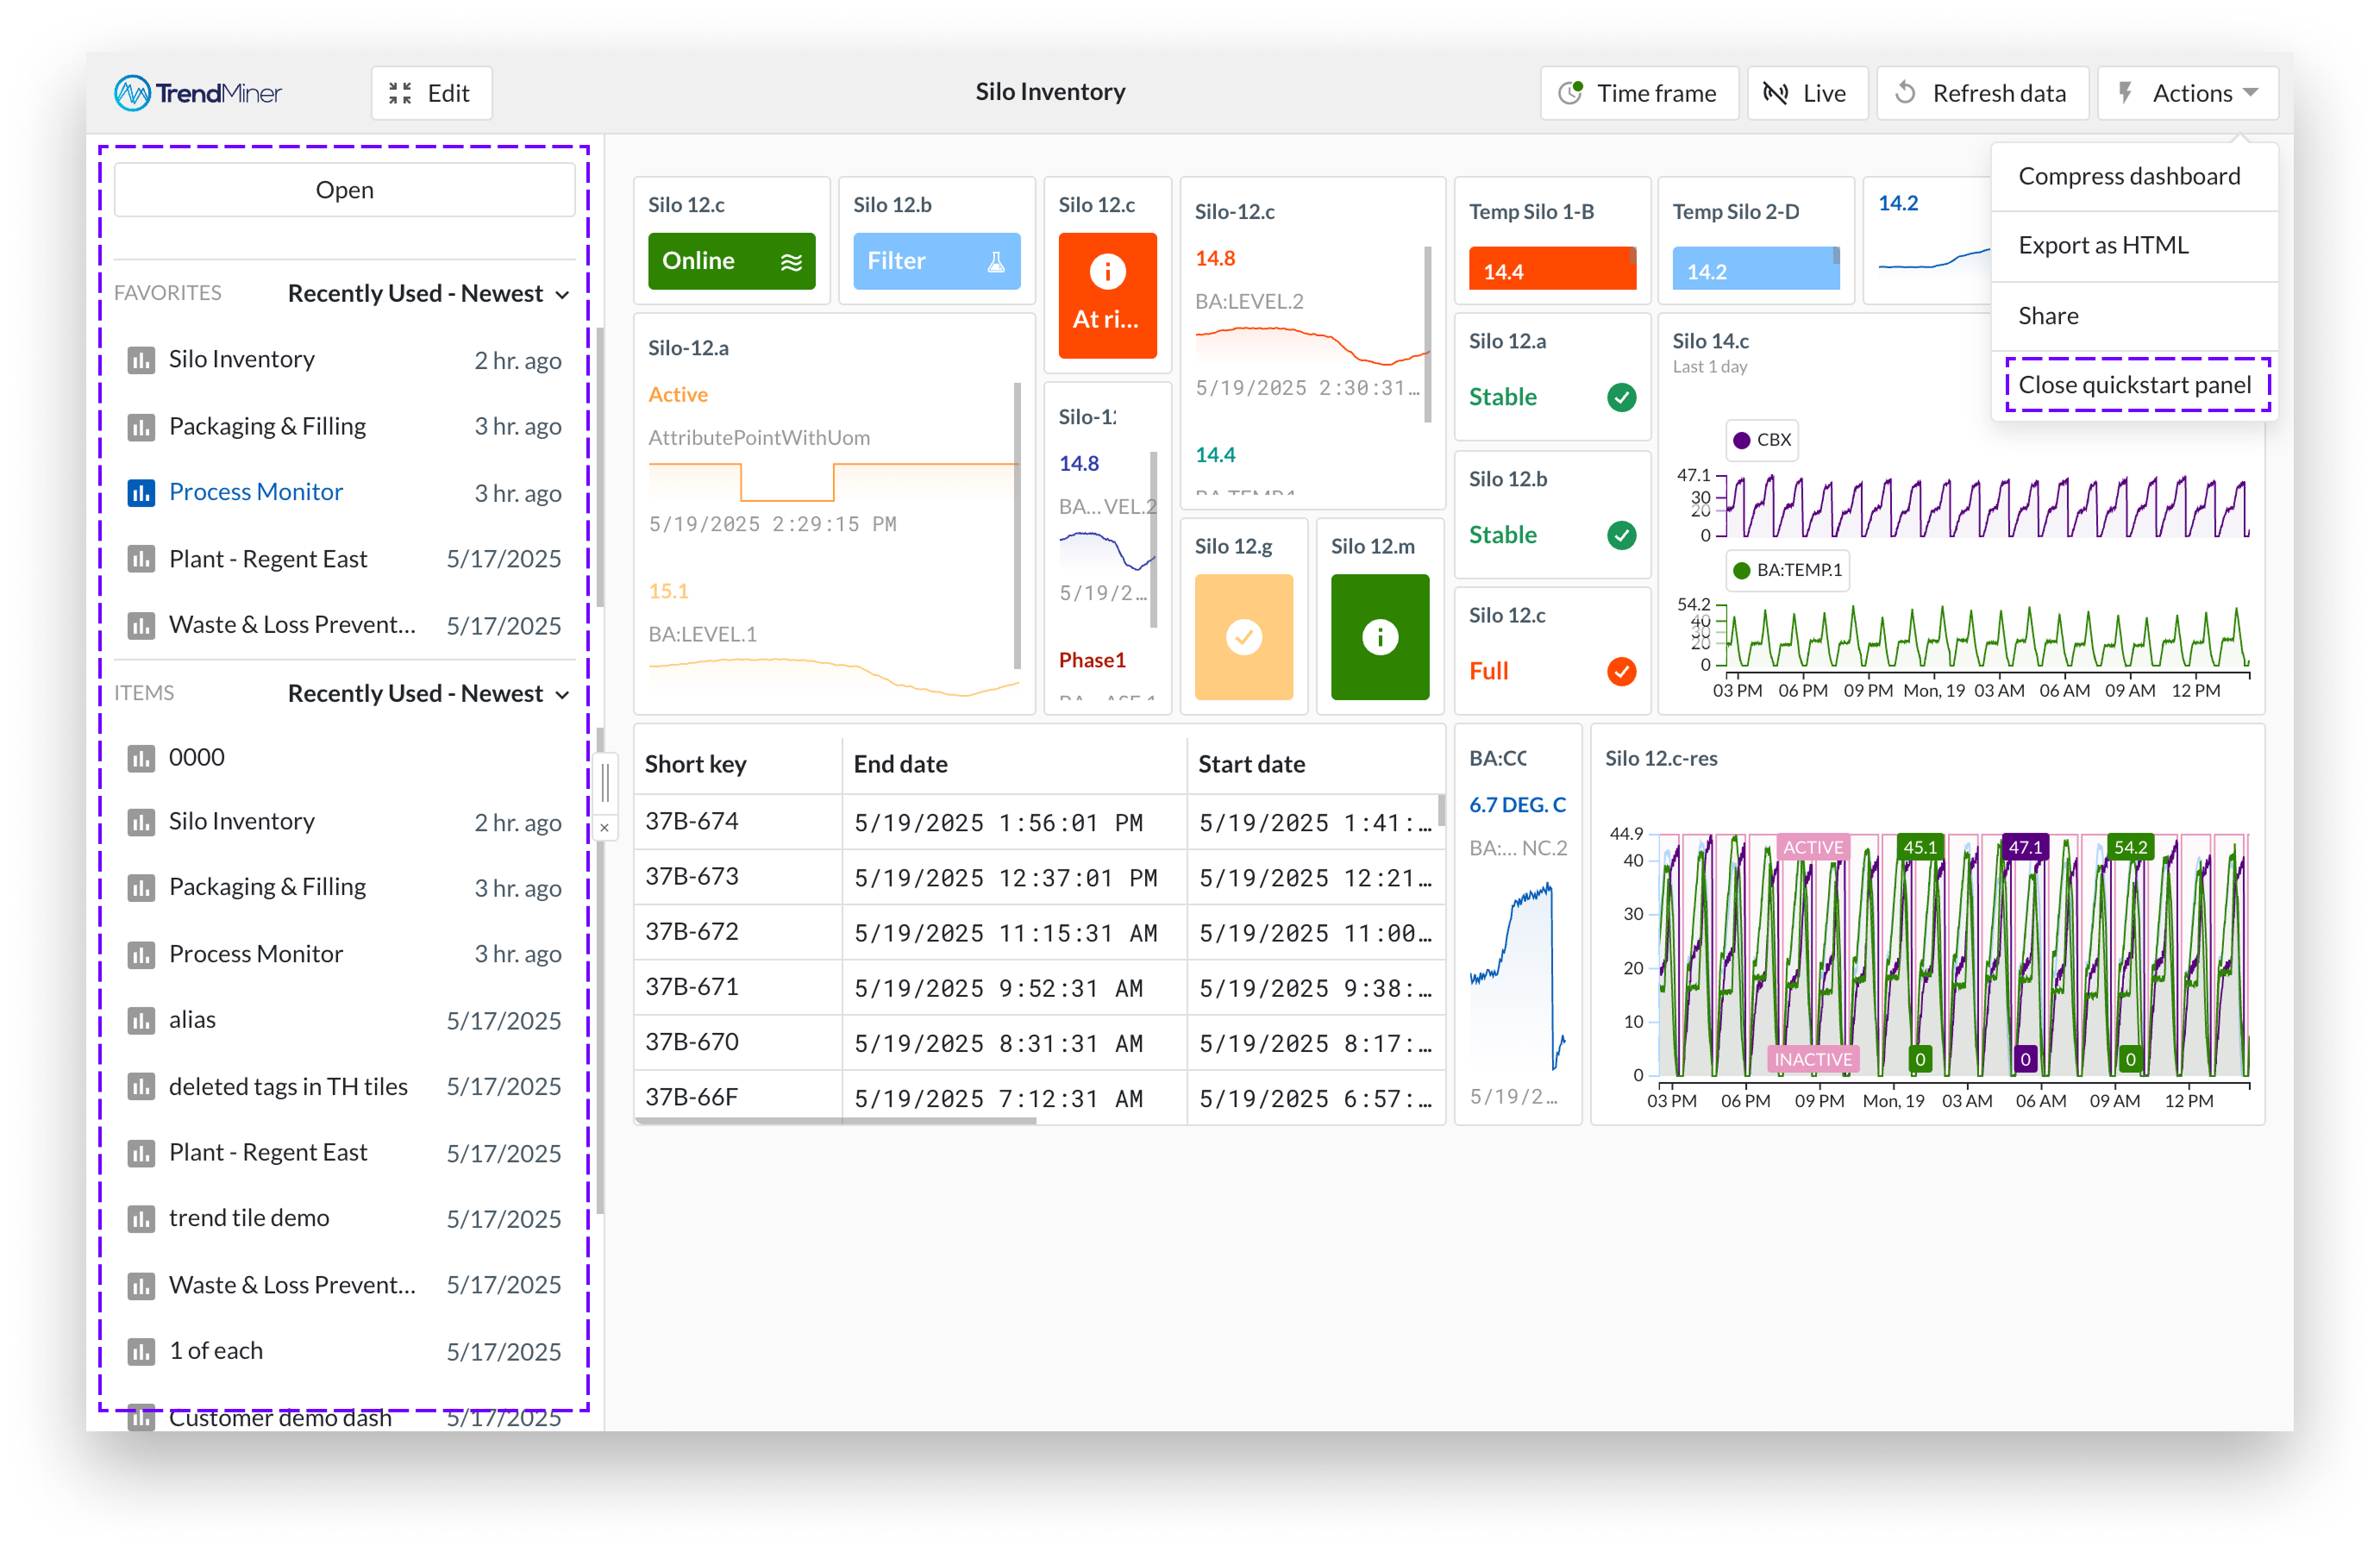
The Open quickstart panel option is available in the actions menu and allows you to keep the quickstart panel open for easy navigation through your dashboards. This is especially useful for operators who want a quick overview of the plant status without being locked into edit mode.
The setting is saved with your user preferences, so you don’t need to re-enable it each time you switch modes or log back in.
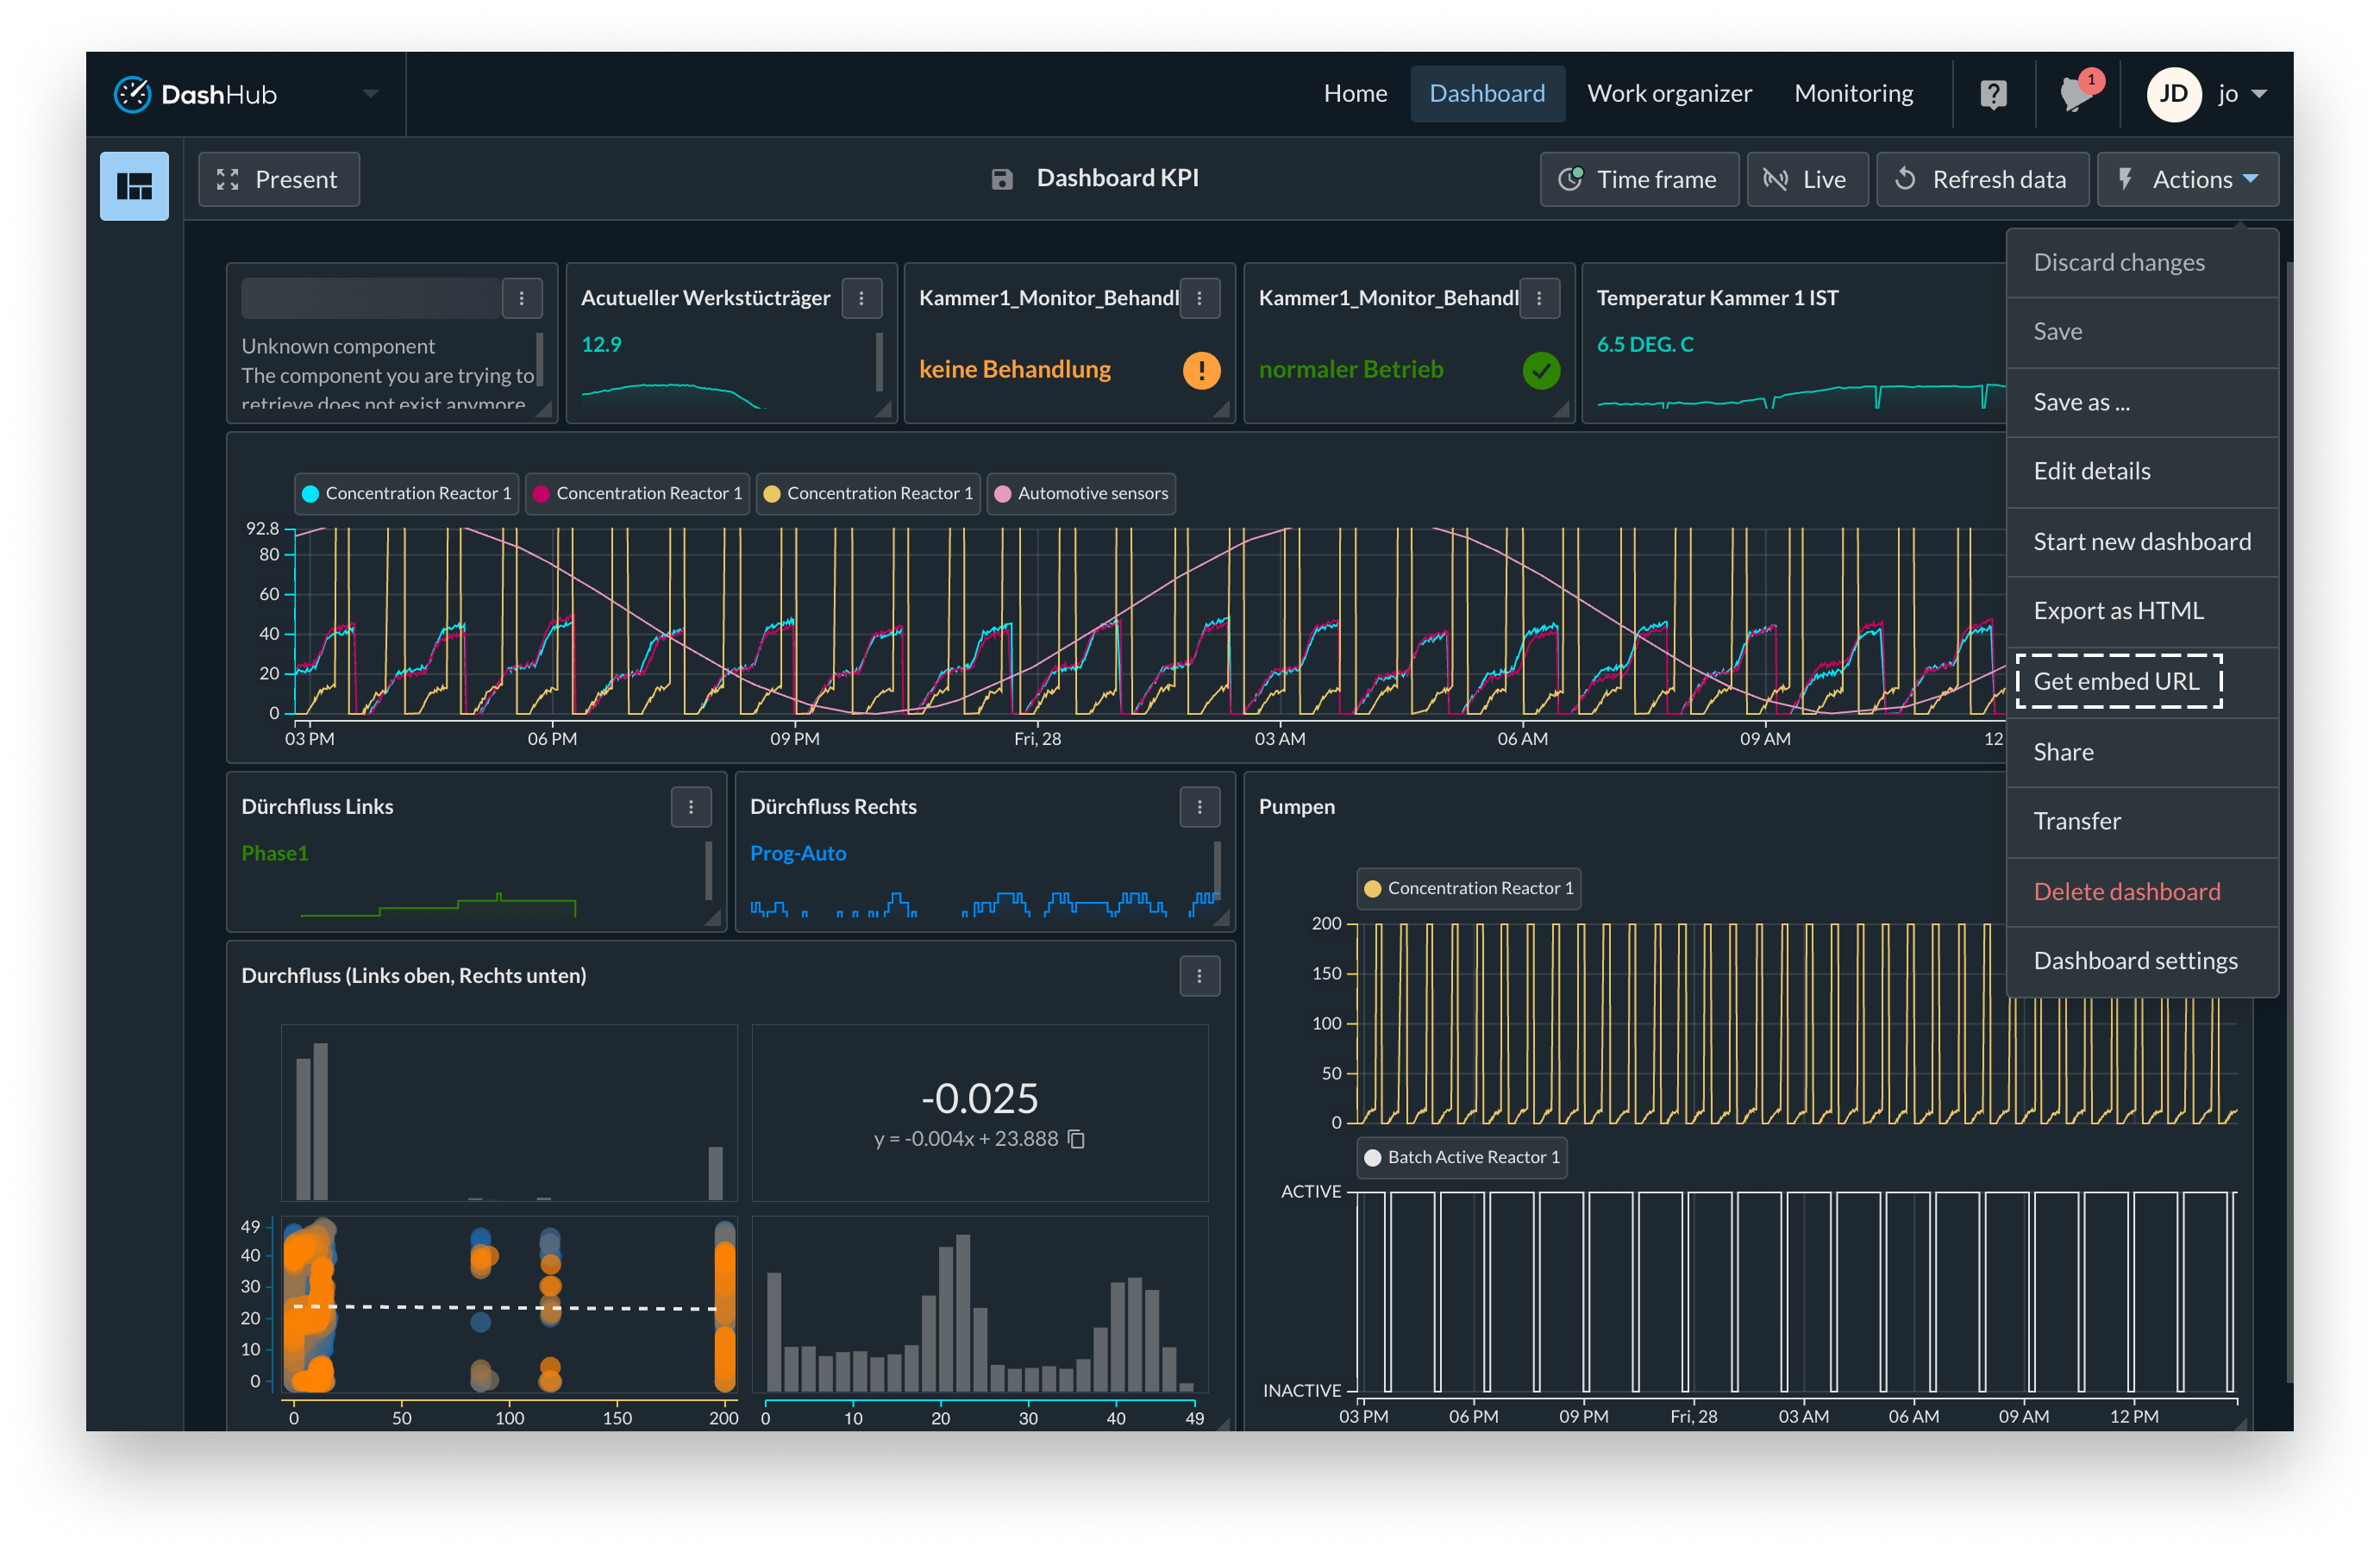
To embed a DashHub dashboard in another application using an iframe, you first need to retrieve the embed URL. This URL allows the selected dashboard to be displayed securely in an external environment, depending on your organization’s configured trusted domains.
The embed URL only works for domains that are listed on the Iframe embedding configuration page in ConfigHub. If the target domain is not on this list, the dashboard will not load.
For optimal display, the minimum iframe dimensions are 500 x 500 pixels.
When a dashboard is embedded through an iframe, it is displayed in a dedicated embed mode, which provides a focused, read-only experience similar to presentation mode. Only dashboards can be embedded; other hubs are not supported in this mode.
All clickable actions on tiles remain functional. When a user clicks on an interactive tile element, the corresponding TrendMiner Hub opens in a new browser tab rather than inside the embedded frame.
In embed mode, the embedded view removes all navigation and top bars to create a cleaner and more focused appearance. The logged-in user session is shared across browser tabs. This means that if you are already logged into TrendMiner in another browser tab, the same user session is automatically applied in the embedded dashboard. If you are not logged in, the embedded frame will display the default login page, prompting you to authenticate before viewing the dashboard.
The Dashboard Export feature allows you to generate an HTML report containing only the context items shown in Context view tiles on your dashboard. This is particularly useful for creating summaries, such as shift handover reports, based on the contextual information displayed.
You can find the Export as HTML option in the Actions menu located at the top of your dashboard. The report includes details of the context items shown in Context view tiles.
Note
The Dashboard export will only export the context item information. Other information on your dashboard, like trends, monitors, text tiles, will not be included.
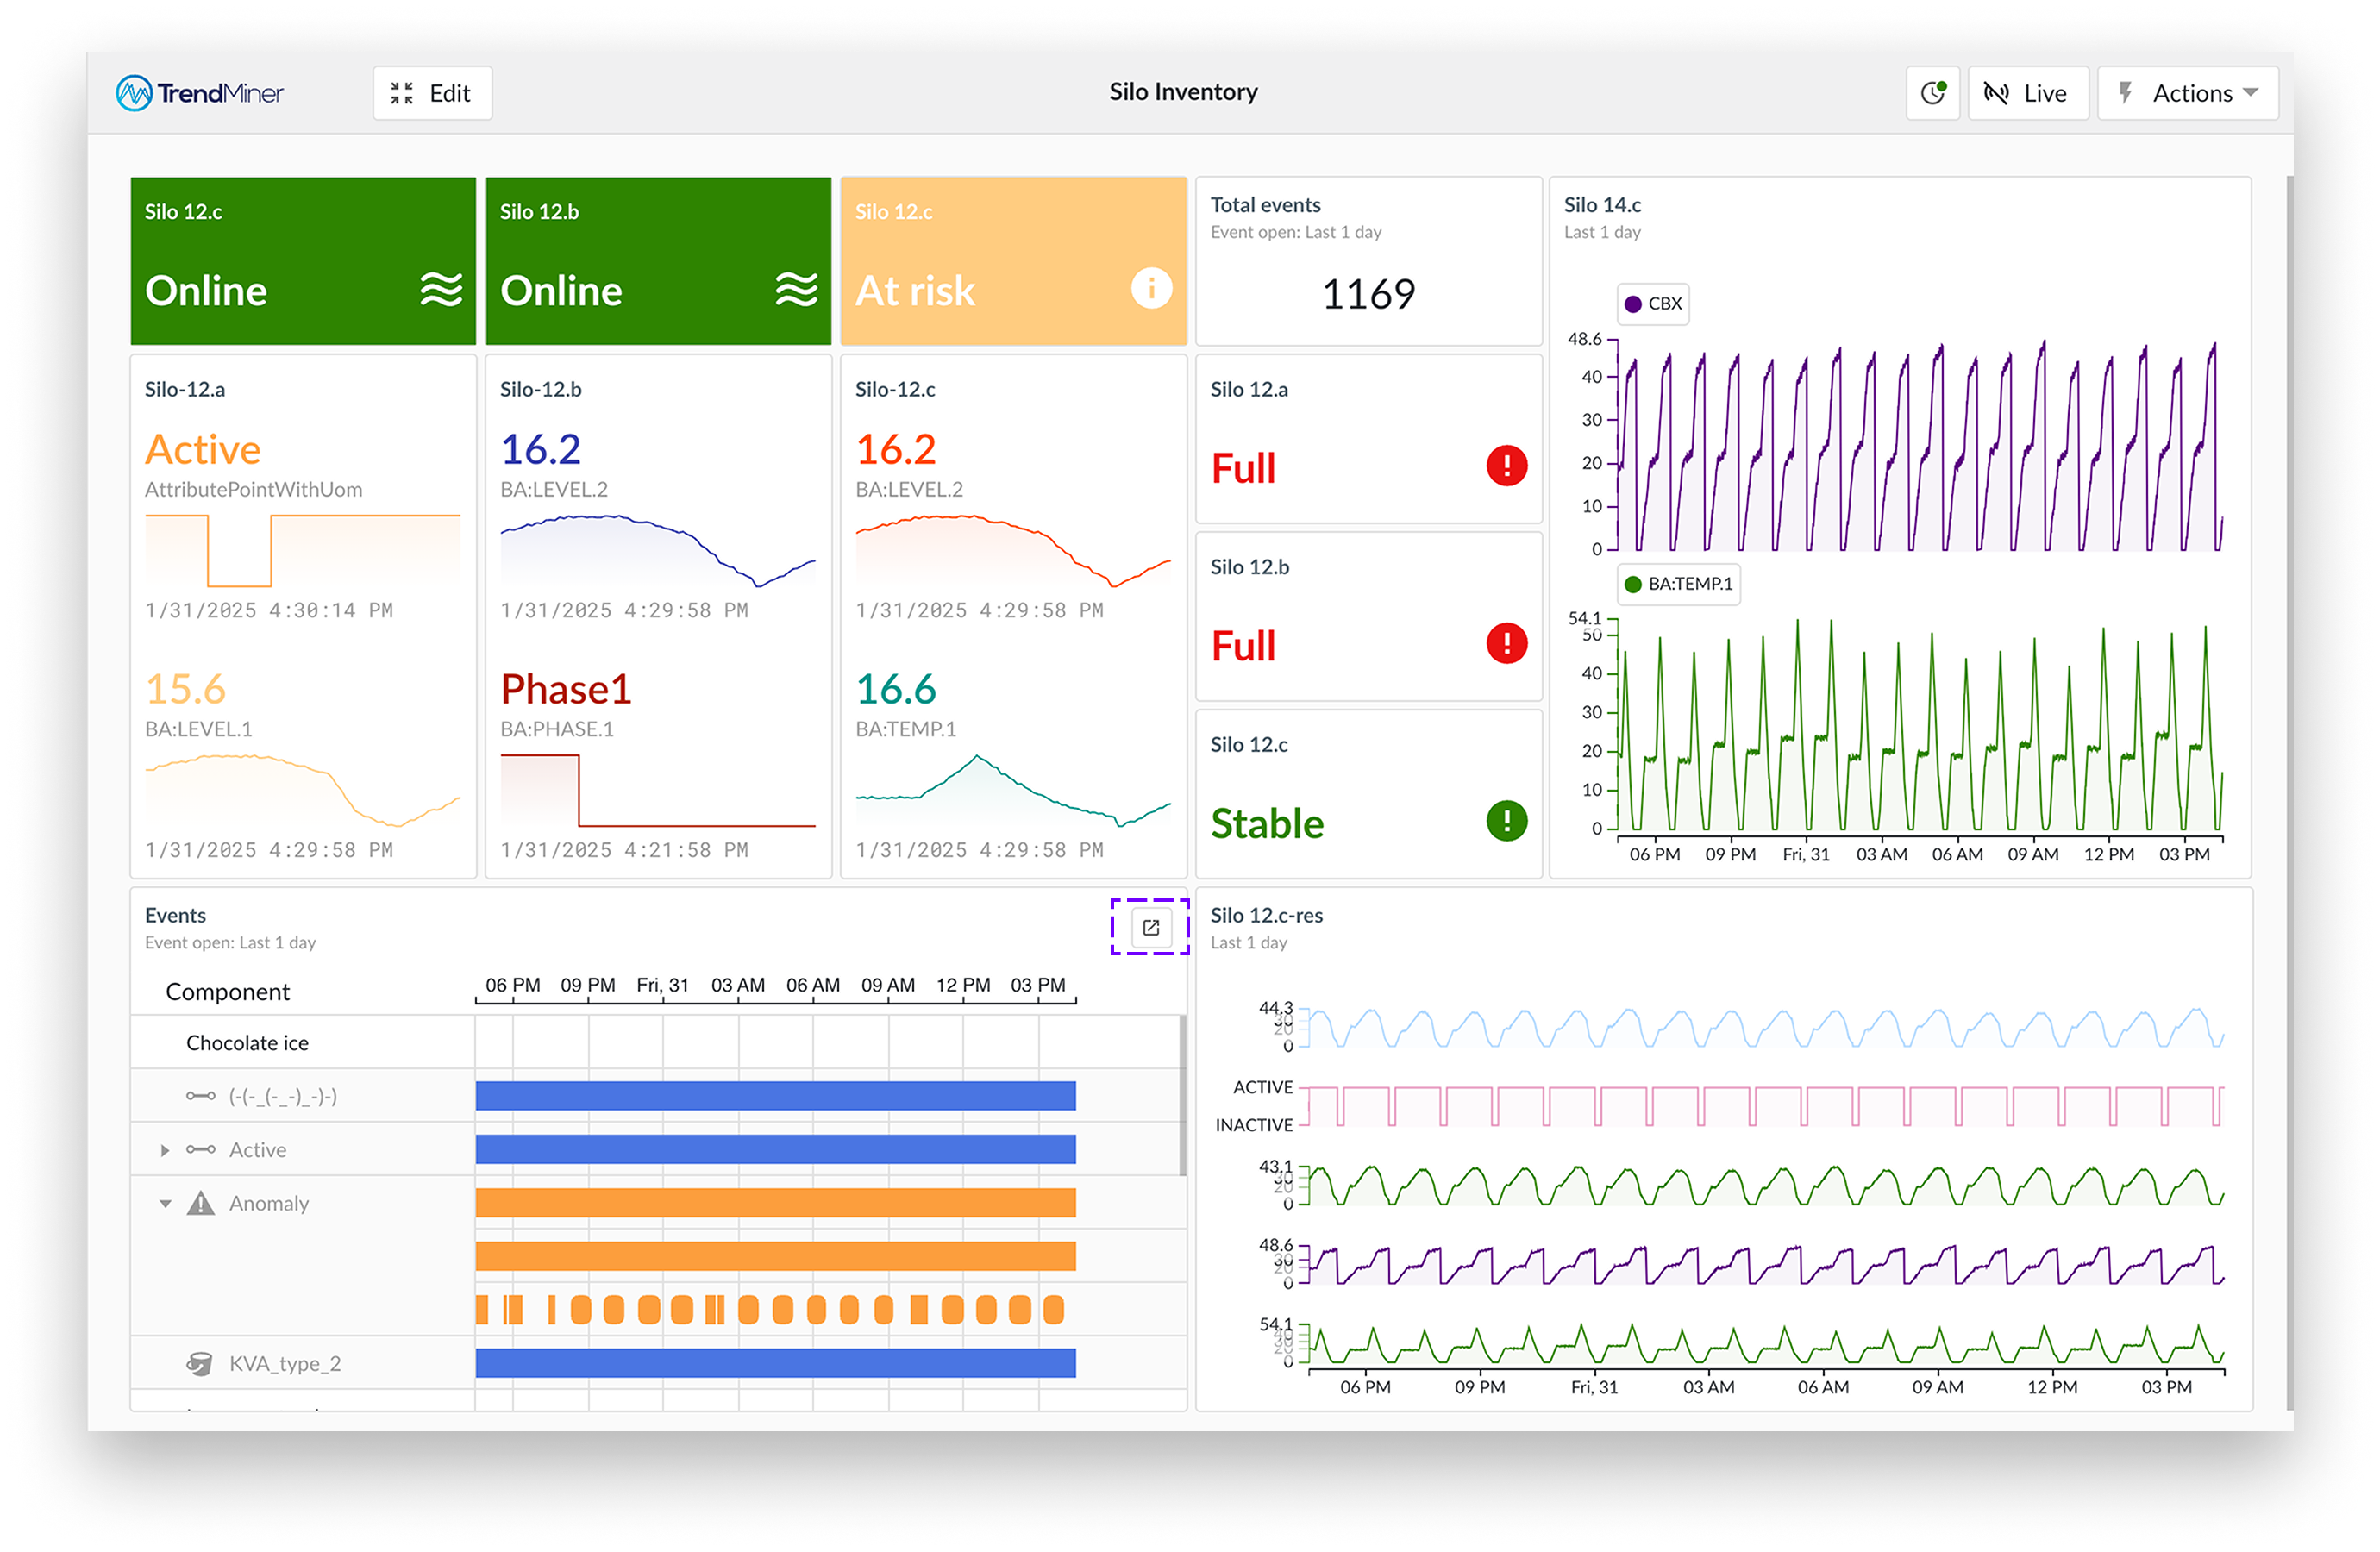
If a tile shows data that requires further exploration, you can use its click-through option to access the detailed view or monitor immediately. Just hover over the tile and click the arrow icon that appears, or click the tile's title to open the source directly.
Clicking on a context item in a tile opens its detail view directly on the dashboard page.
What are dashboard triggers?
A dashboard trigger automatically activates the export of a selected dashboard when a context-item changes state or a certain context type is added to the dashboard.
Why use the trigger?
Your dashboard, running as defined, will provide operators and or engineers all the information pertinent to the process of interest. For example, when an automatically created context item of type "shift" is created, an export of the board in the form of a process report can be set to automatically create and attach to the item, during a predetermined shift change.
Anyone with access to the item will be able to download and read the latest process report, relinquishing the need to manually create the report.
How to create a dashboard trigger
The dashboard trigger can be created in ContextHub. It requires a workflow to be setup so that you can create the "states" necessary to trigger the delivery of a dashboard report based on your tile status. These triggers fire automatically when your chosen state has been met. Your trigger requirement could be a shift change, the end of a process run, or a paused process.
Create a context type as normal.
Identify the context item type in context item type grid, click the three dots at the far right of the row.
In the drop down, select "Edit dashboard triggers".
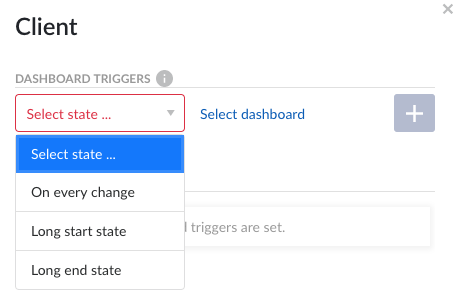
A panel will appear from the right, select a state on which the trigger should activate.
Click on "Select dashboard" and identify dashboard of interest.
Click on the + sign to add your new trigger to the overview list. This list provides an overview of your preset triggers.
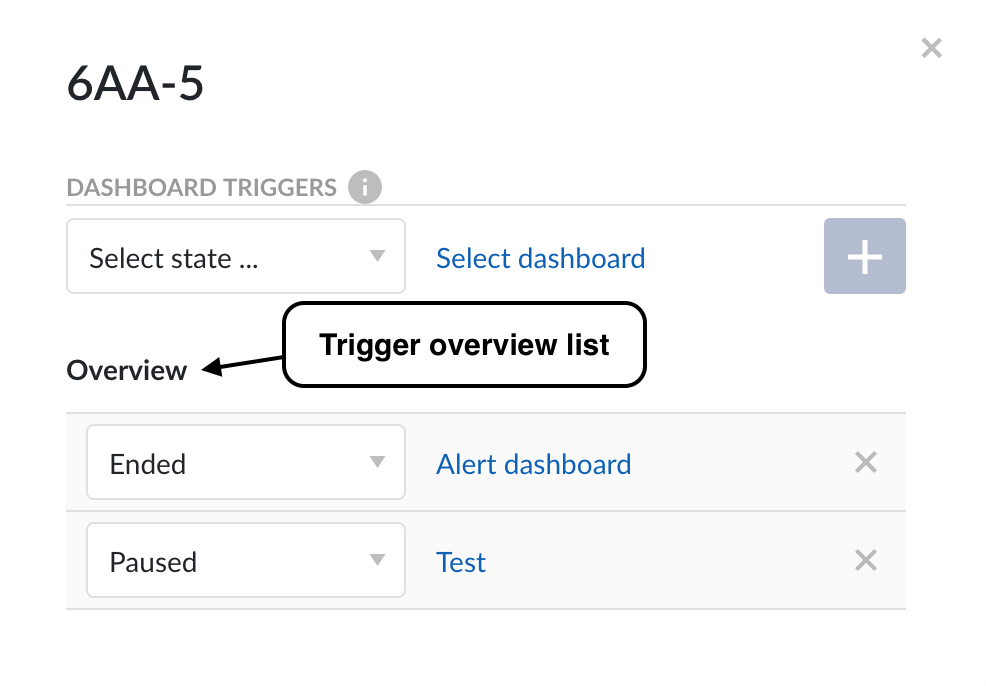
Your trigger is now set to create a report automatically, at your preselected time(s).