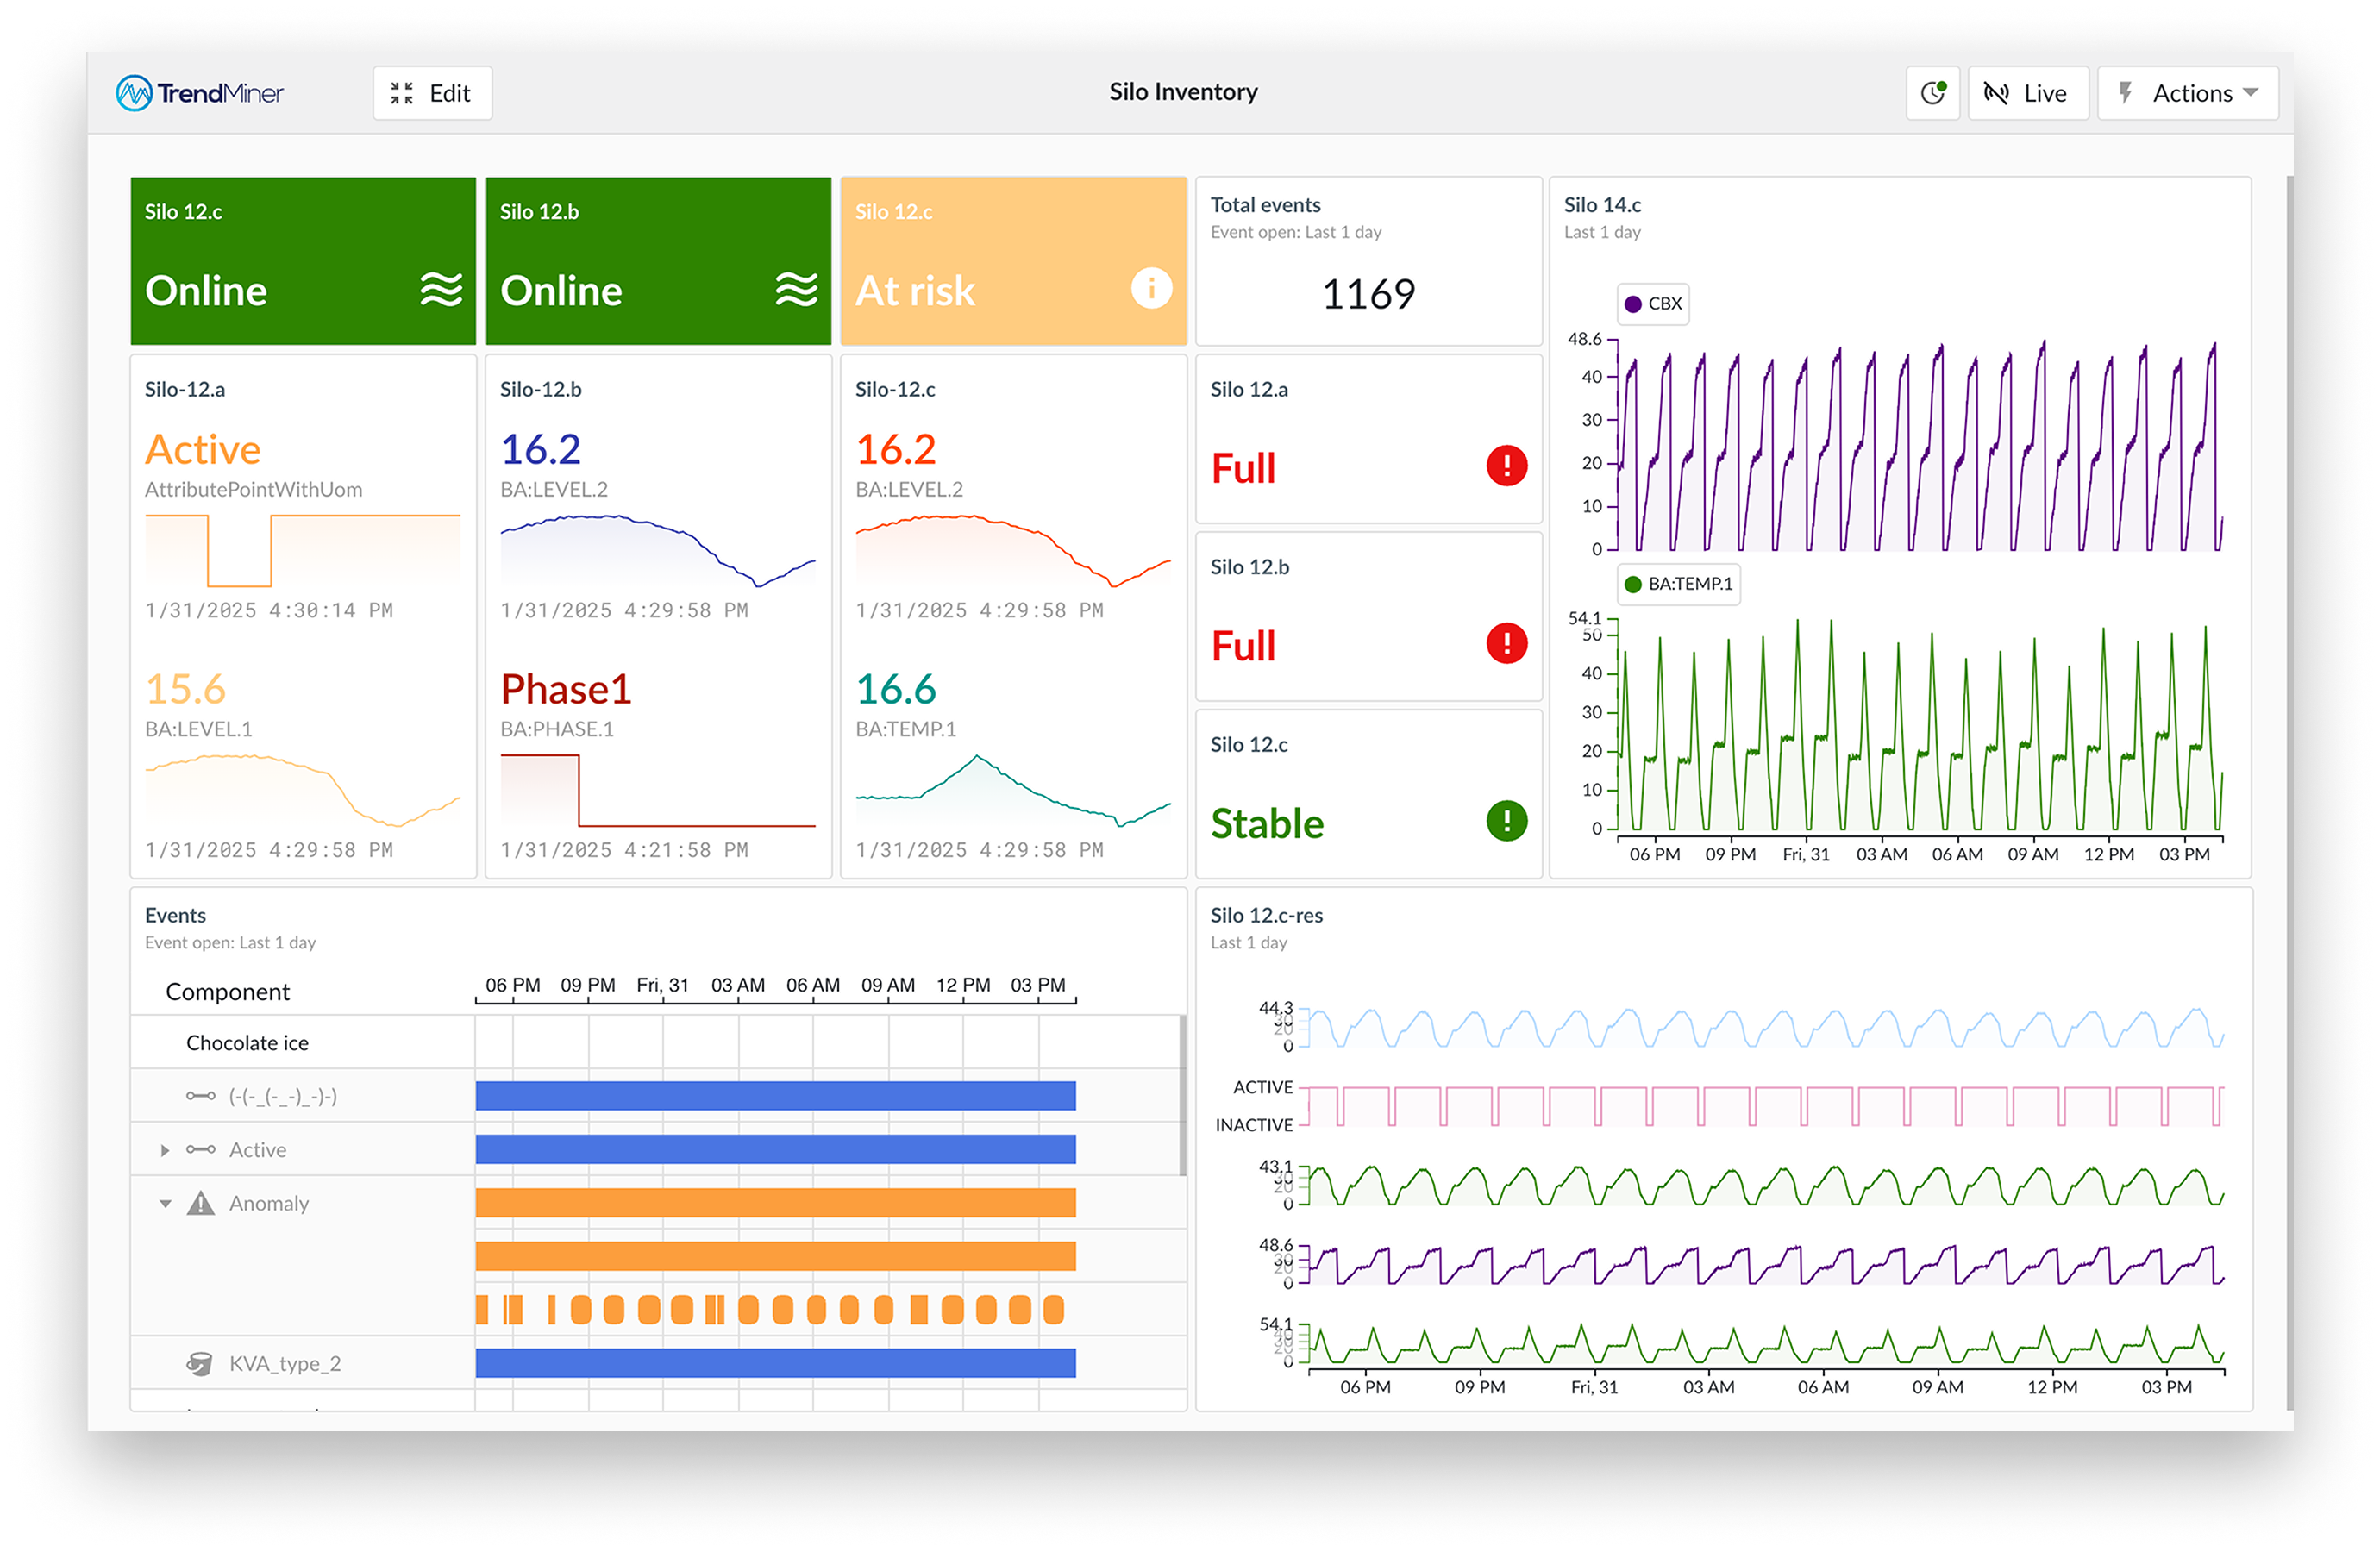
Dashboard
DashHub combines actionable dashboards with powerful visualization capabilities, giving you a structured overview of the insights you create in TrendMiner. It allows you to track events, identify trends, and respond to data in real-time, providing you with a clear and comprehensive view of your operations.
DashHub does more than just visualize your data. It centralizes data and events, offering a unified view that lets you easily monitor the current status of your operations. When you need deeper analysis, you can click through directly to perform advanced calculations, refine your data, and carry out diagnostic and discovery analytics.
By integrating both high-level visualization and deeper insights in one place, DashHub empowers you to make data-driven decisions.
The dashboard acts as your central control hub, with each tile offering an individual view into TrendHub, ContextHub, and your monitors and alerts, enabling seamless collaboration across teams and departments.
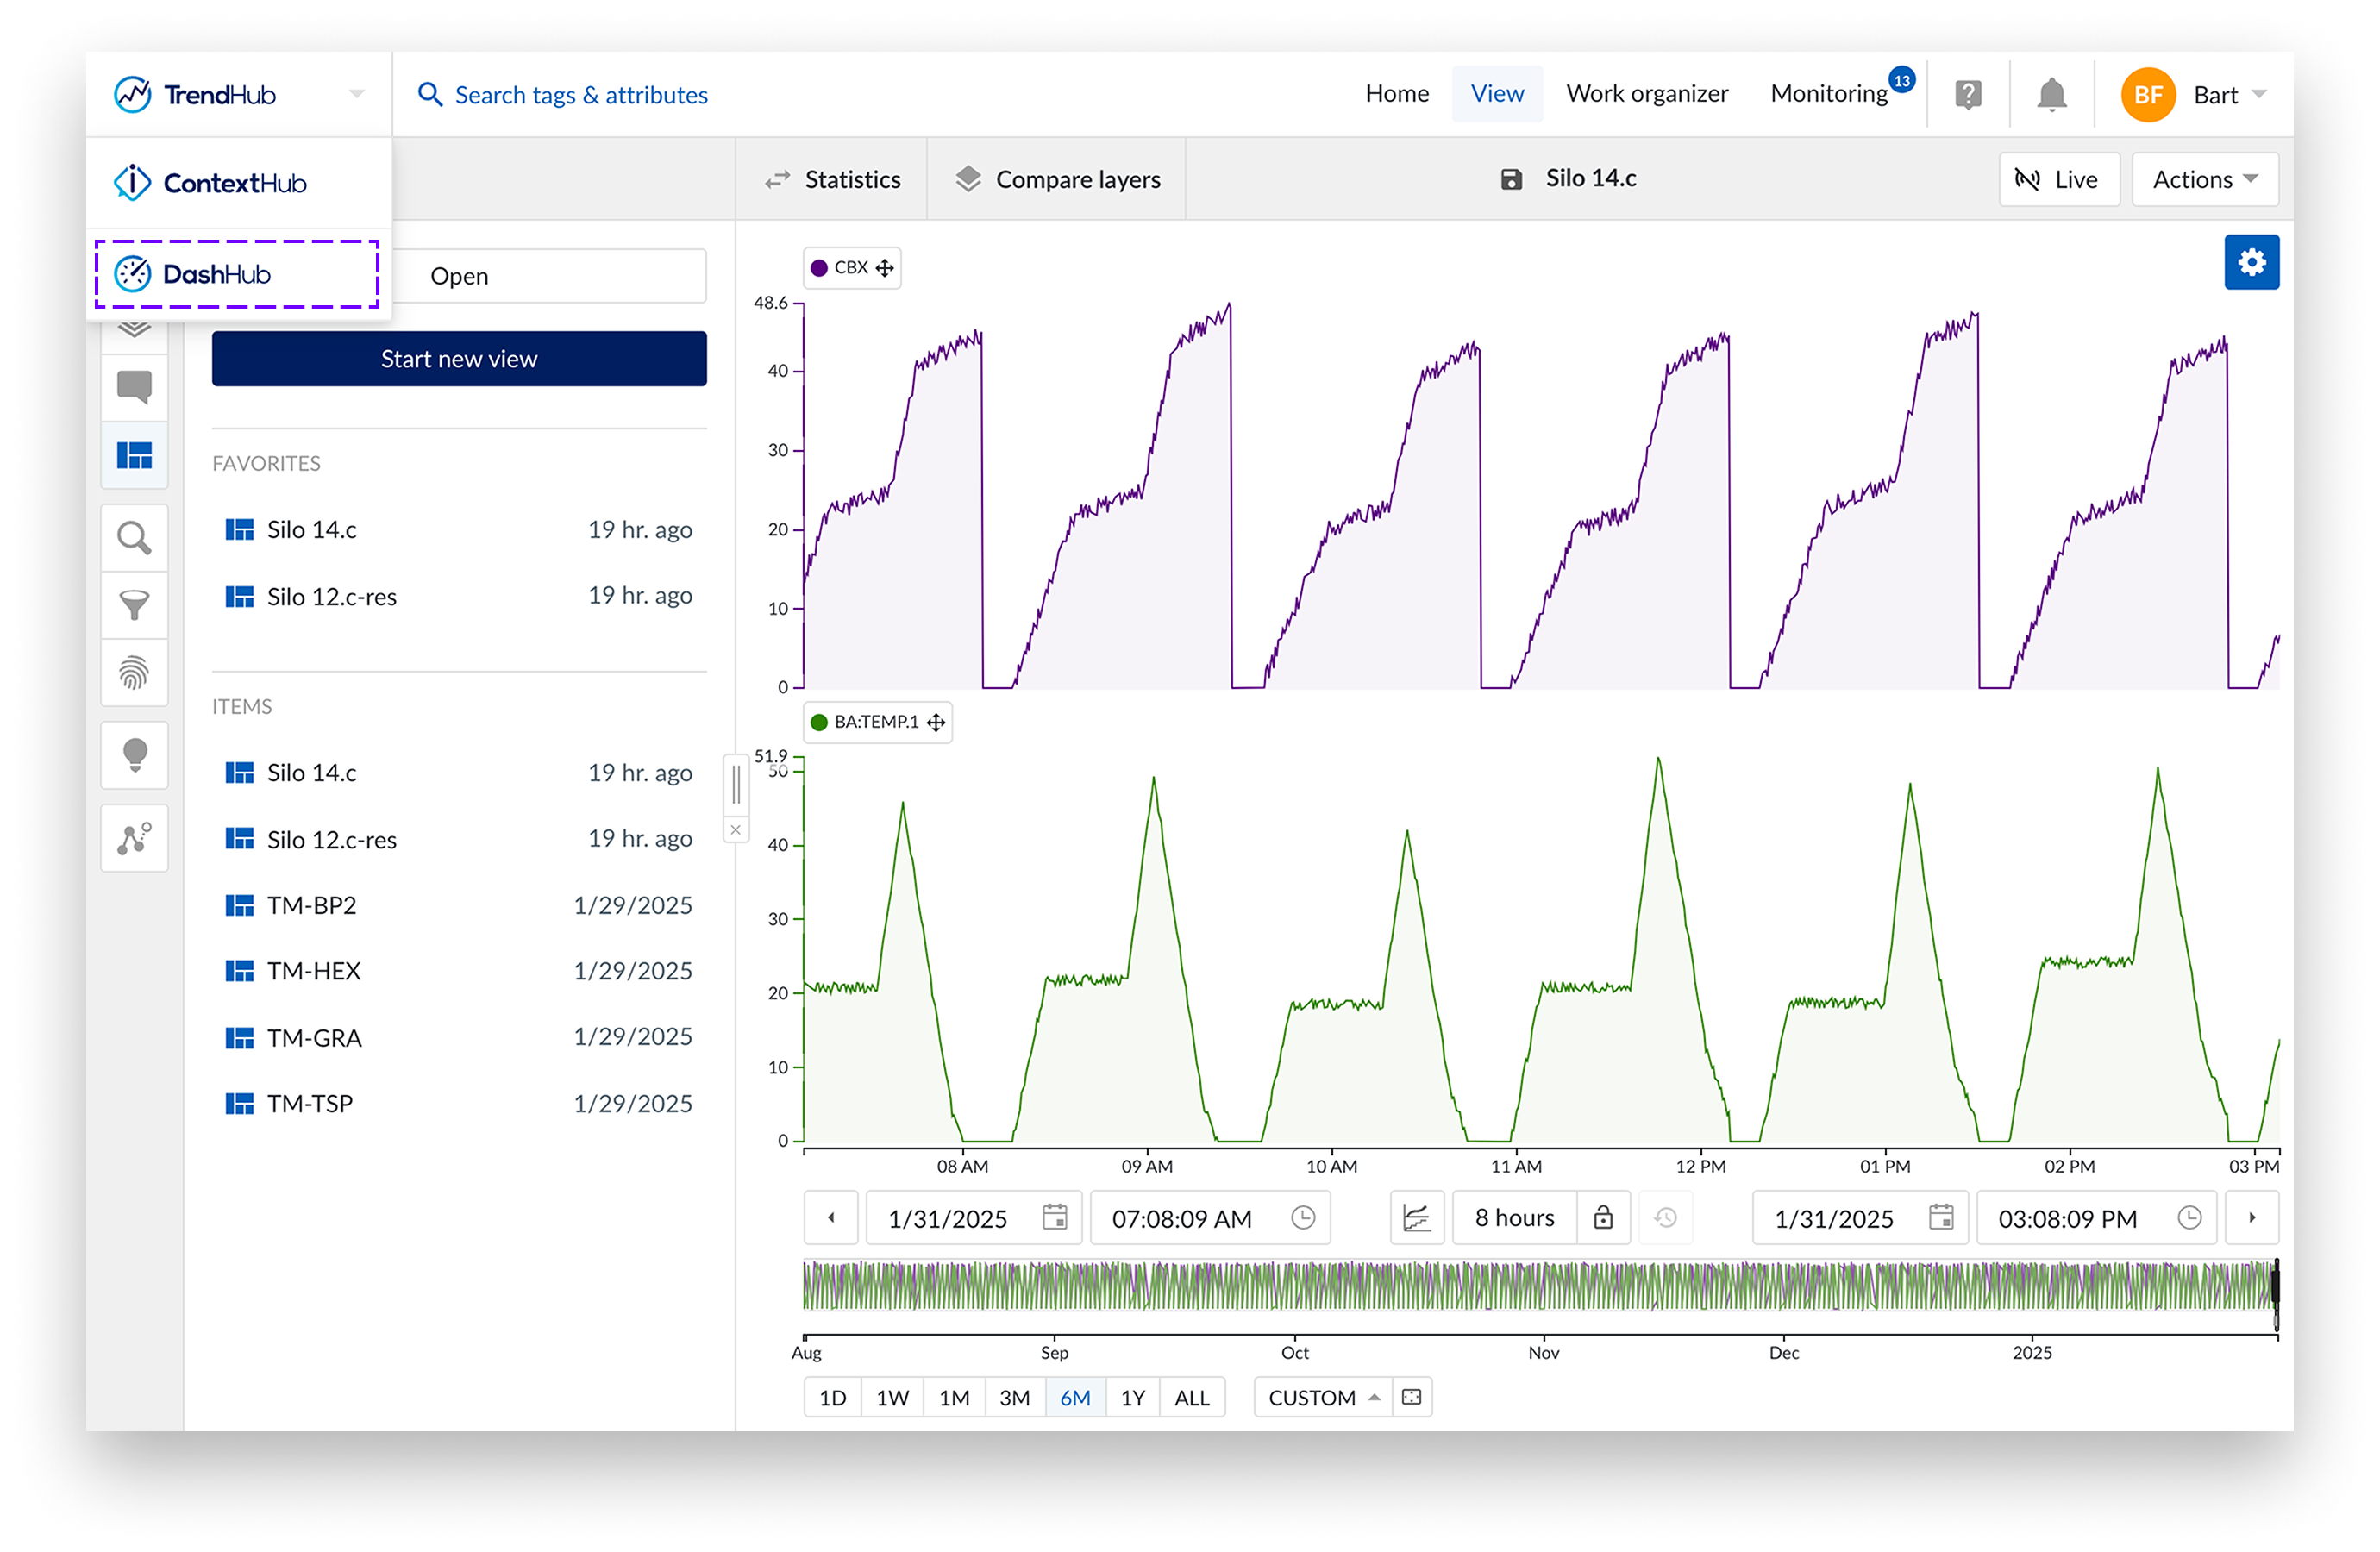
Select DashHub from the Hub selector
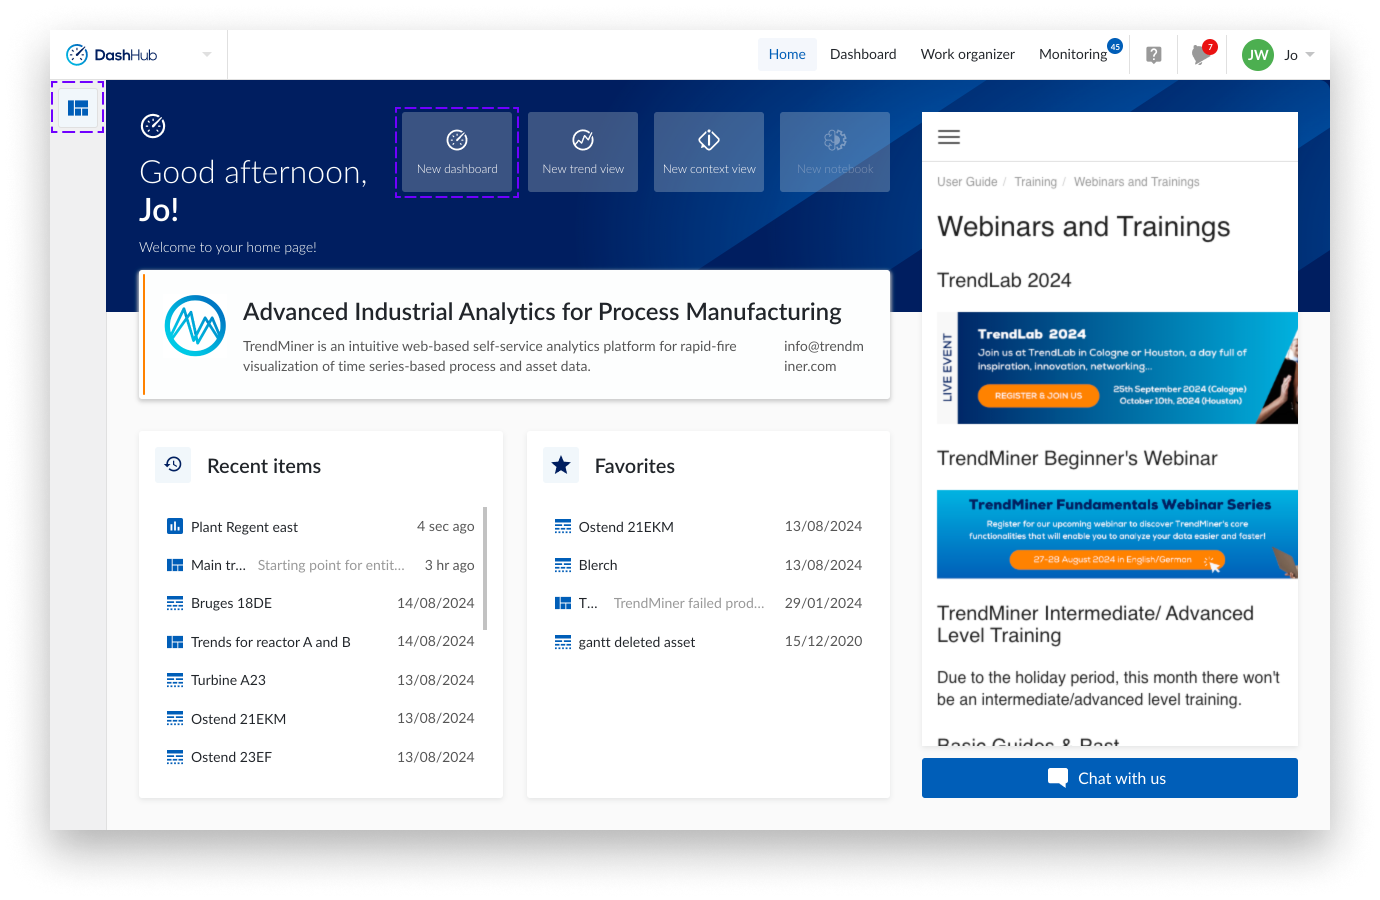
From the DashHub homepage there are 2 options to create a new dashboard:
Select “New dashboard”
Select the “Dashboards” icon from the left bar.
A new empty dashboard is opened.
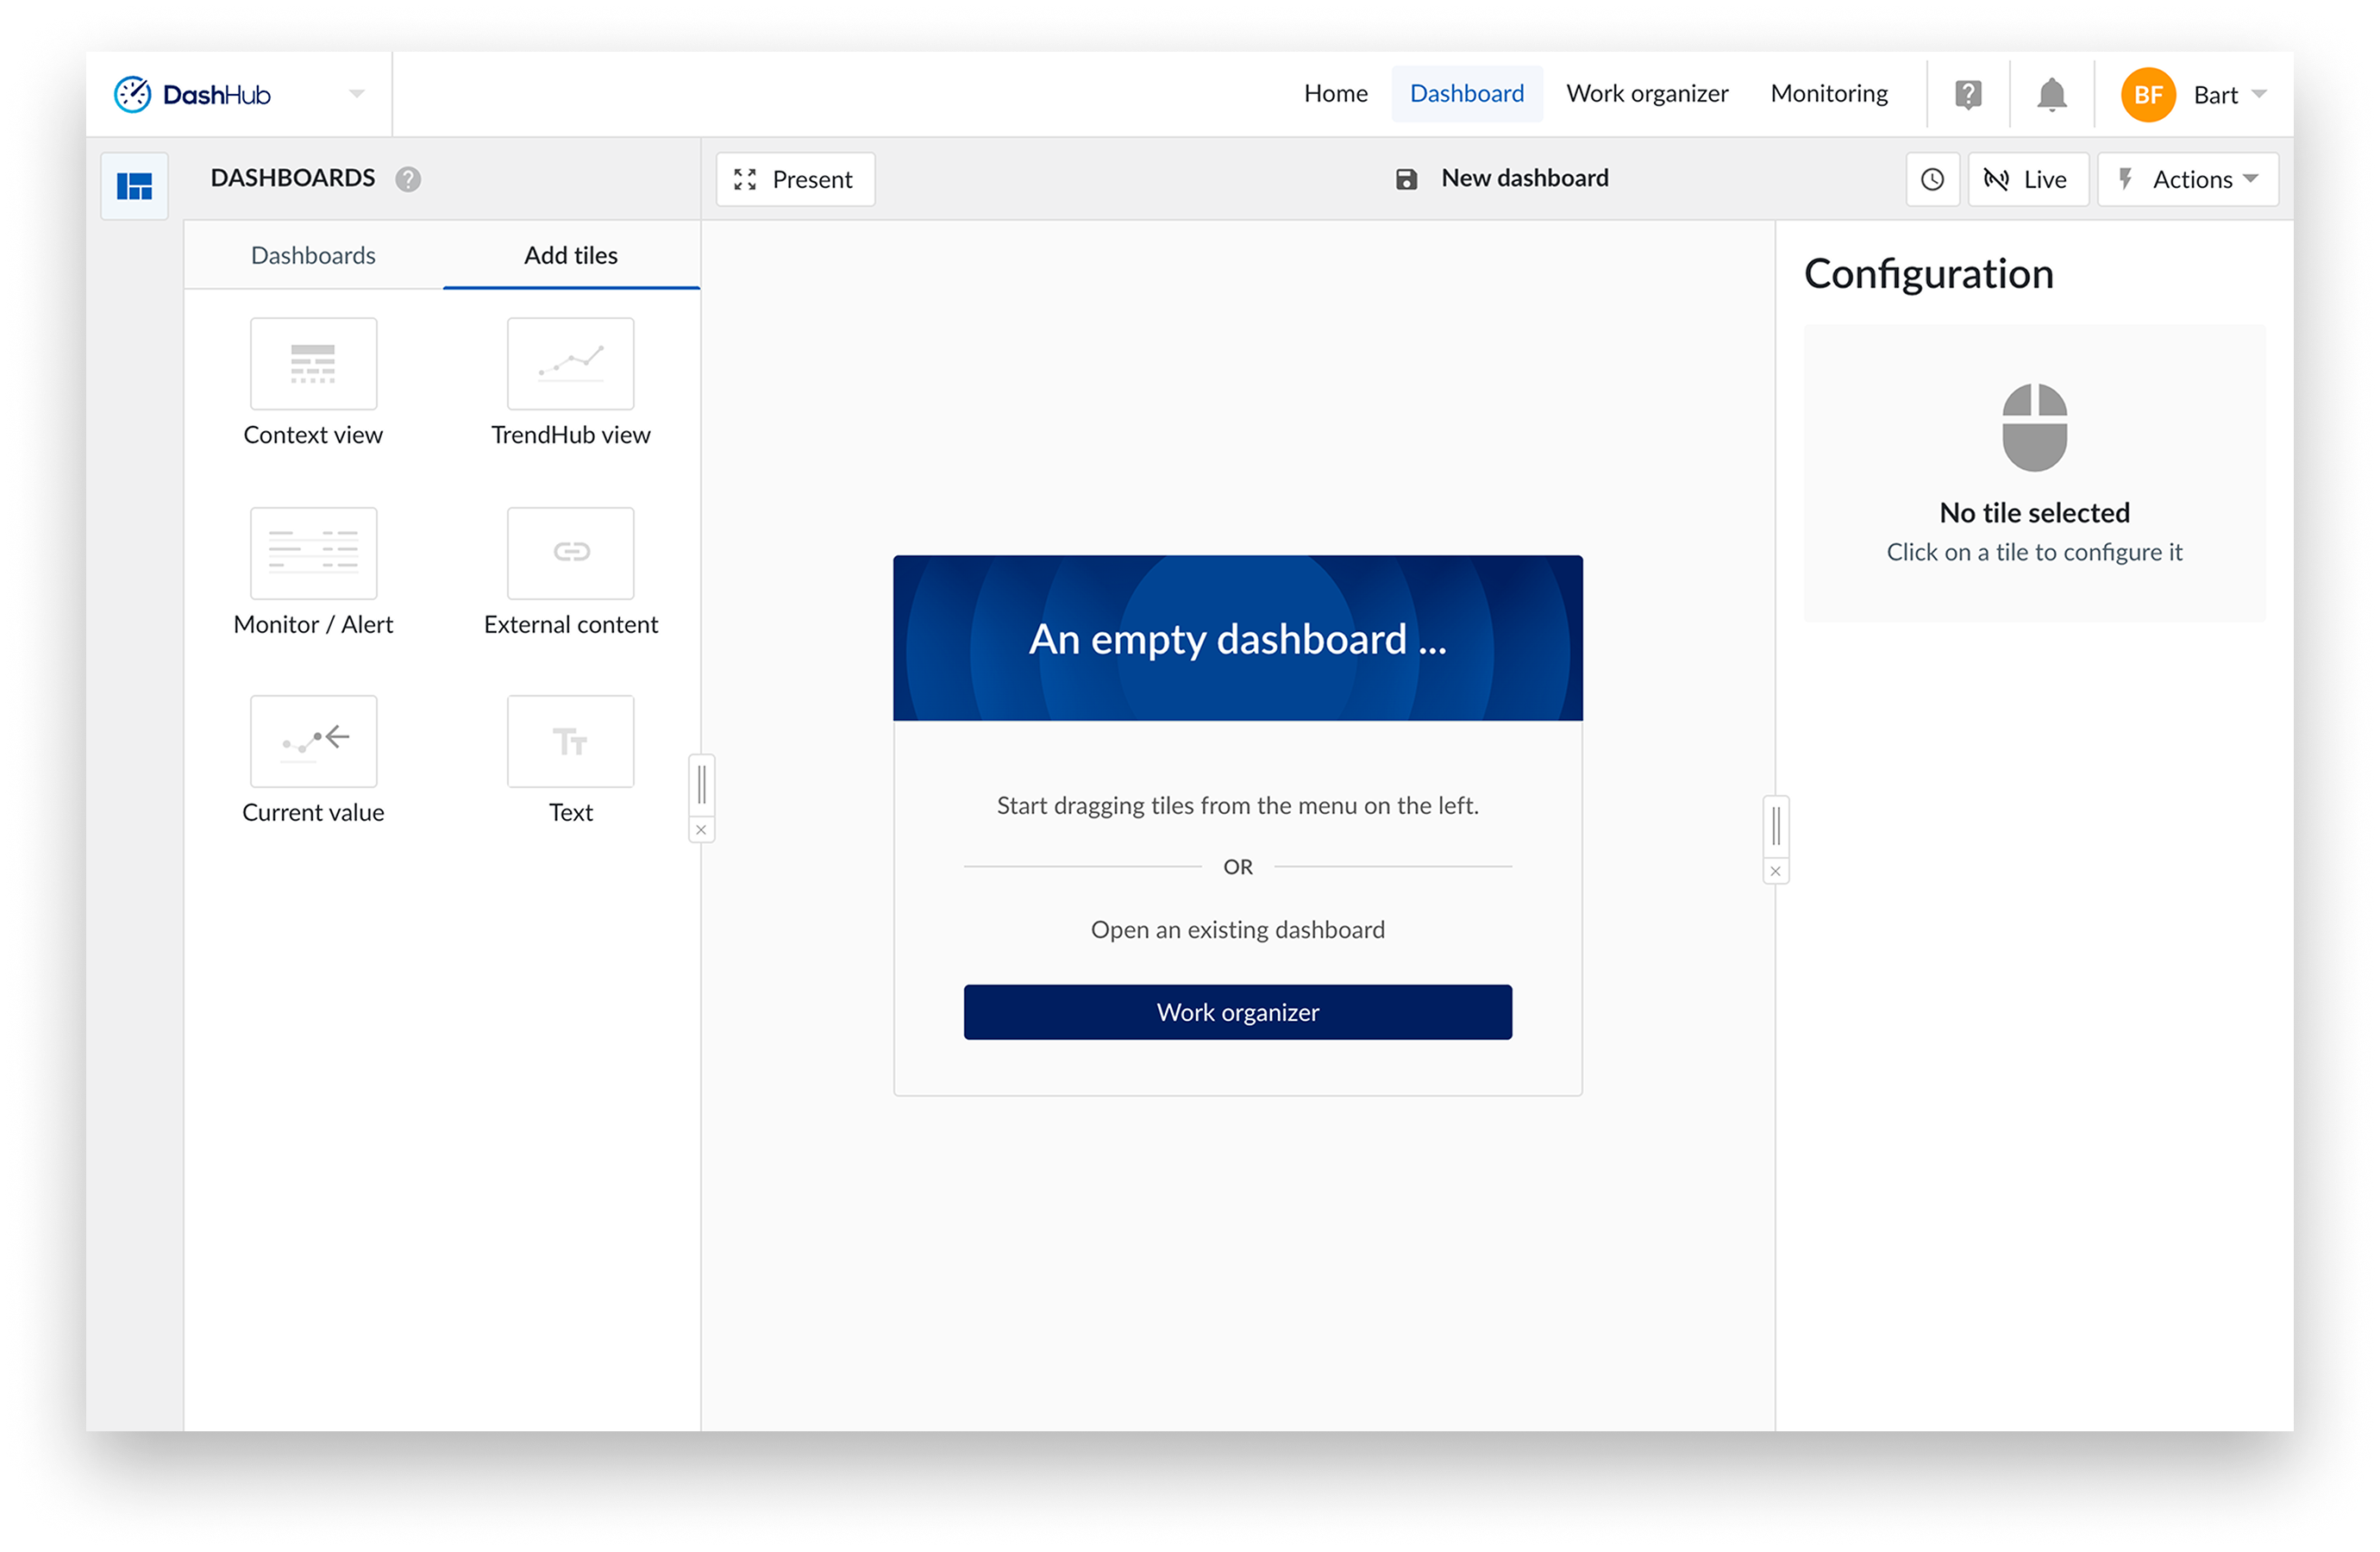
Configure the new dashboard.
Save the new dashboard.
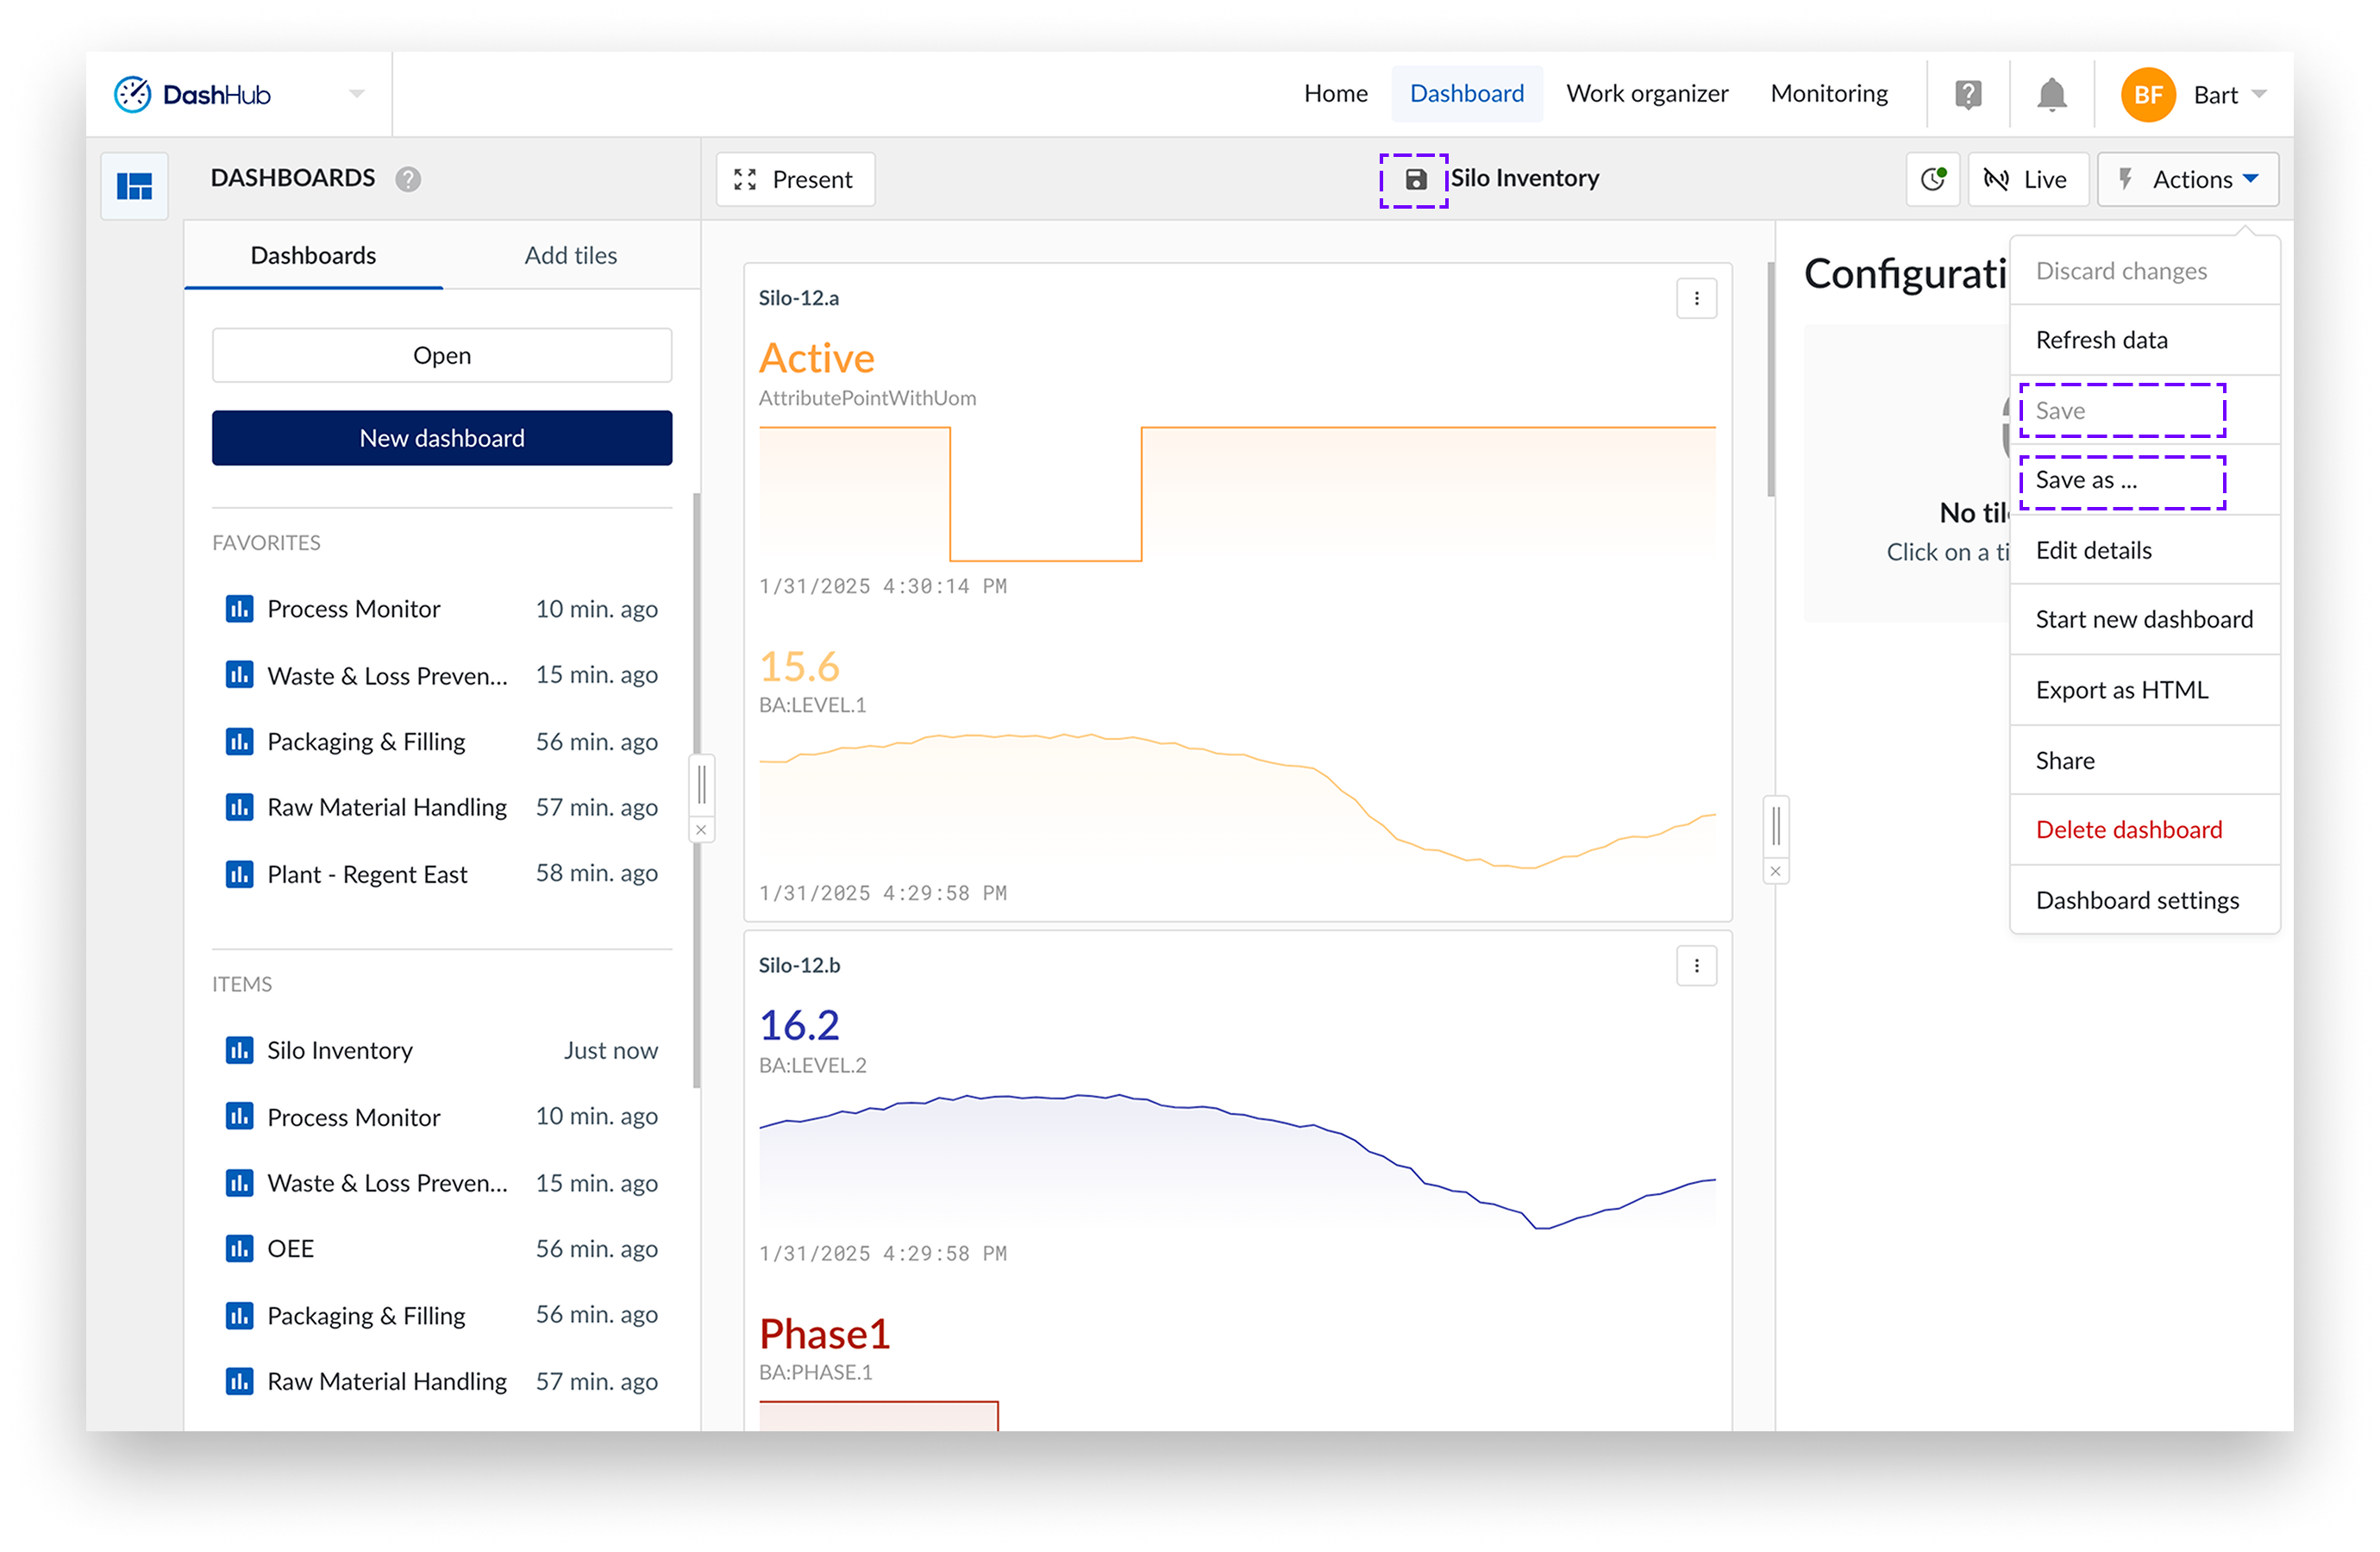
Clicking the save icon on top will open the “Save” or “Save as ..” option from the “Actions” menu.
Select “Save” or “Save as ..” from the “Actions” menu.
You can share your dashboard with other users either by:
Using the Actions Menu:
Navigate to the desired dashboard.
Select “Share” from the “Actions” menu.
Through the Work Organizer:
Open the “Work Organizer”.
Locate the dashboard you want to share.
Use the sharing options available within the “Work Organizer”. For information on this read here.