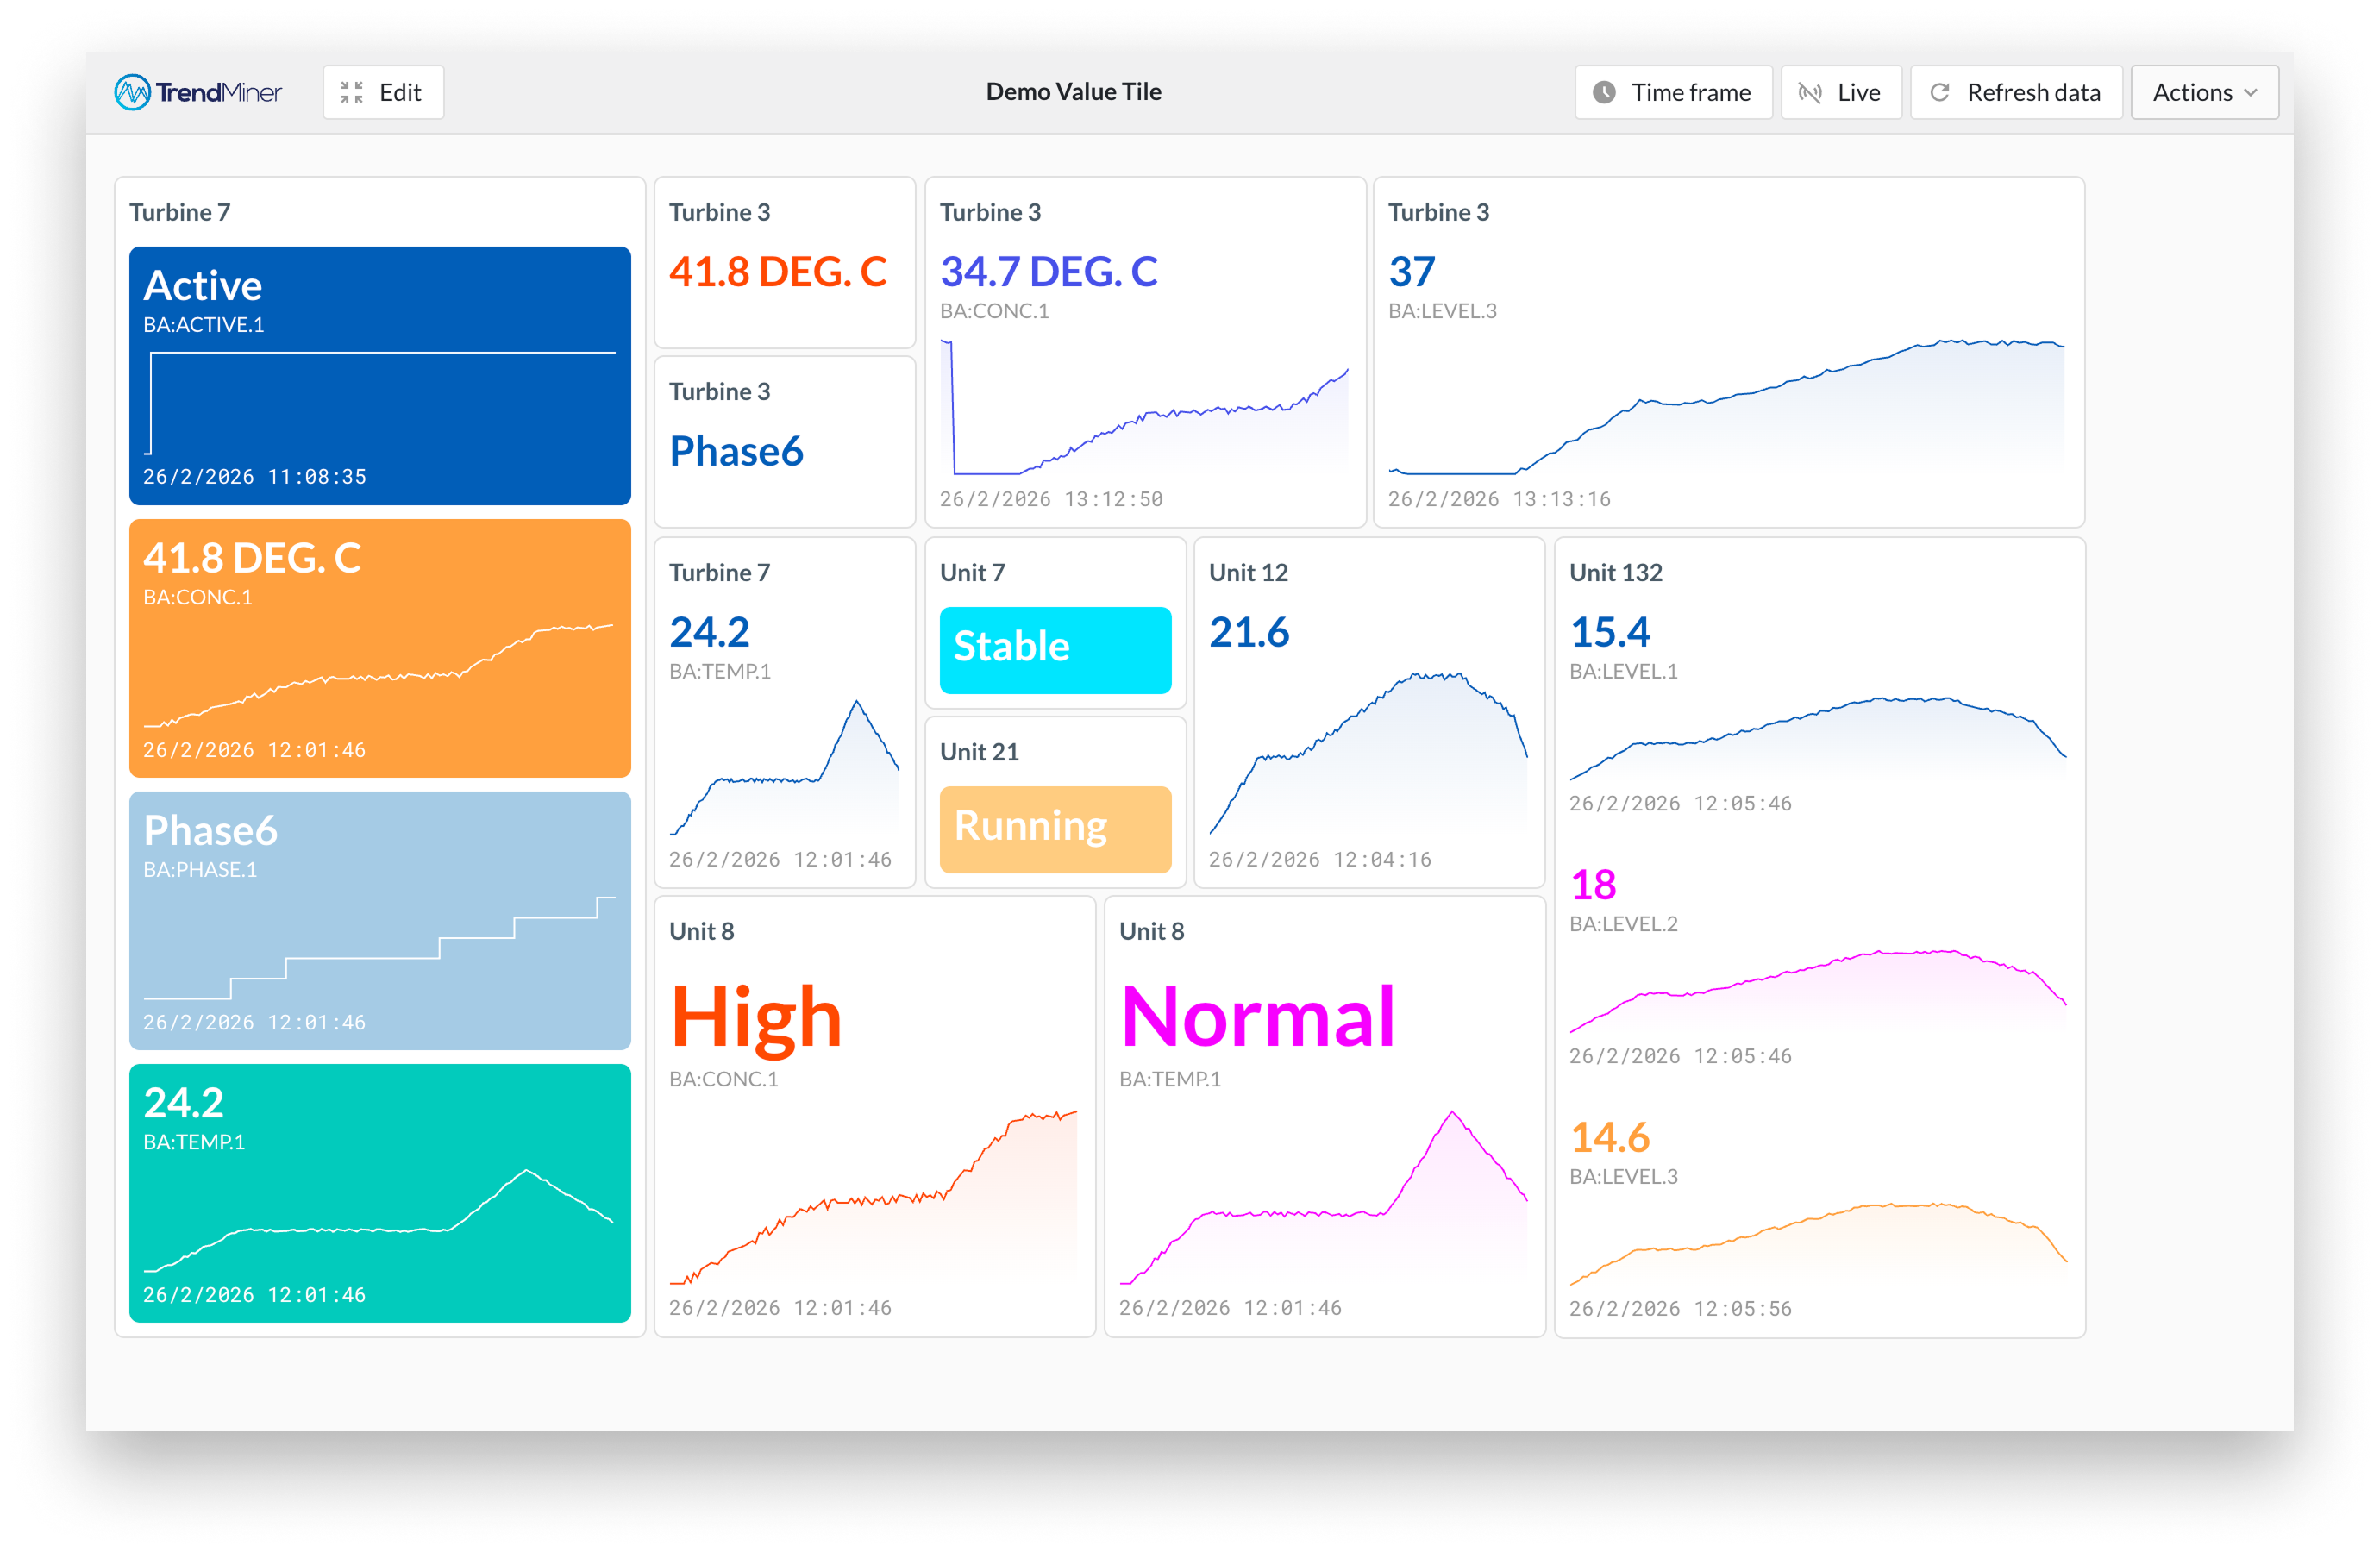
Current value tile
The Current Value tile allows you to easily track the most recent value of one or more selected components. After selecting the components, you can set conditions using operators to highlight specific value ranges, making it easier to visualize the condition of your data at a glance. Additionally, by customizing the tile, you can choose to visualize a graph for progress visualization.
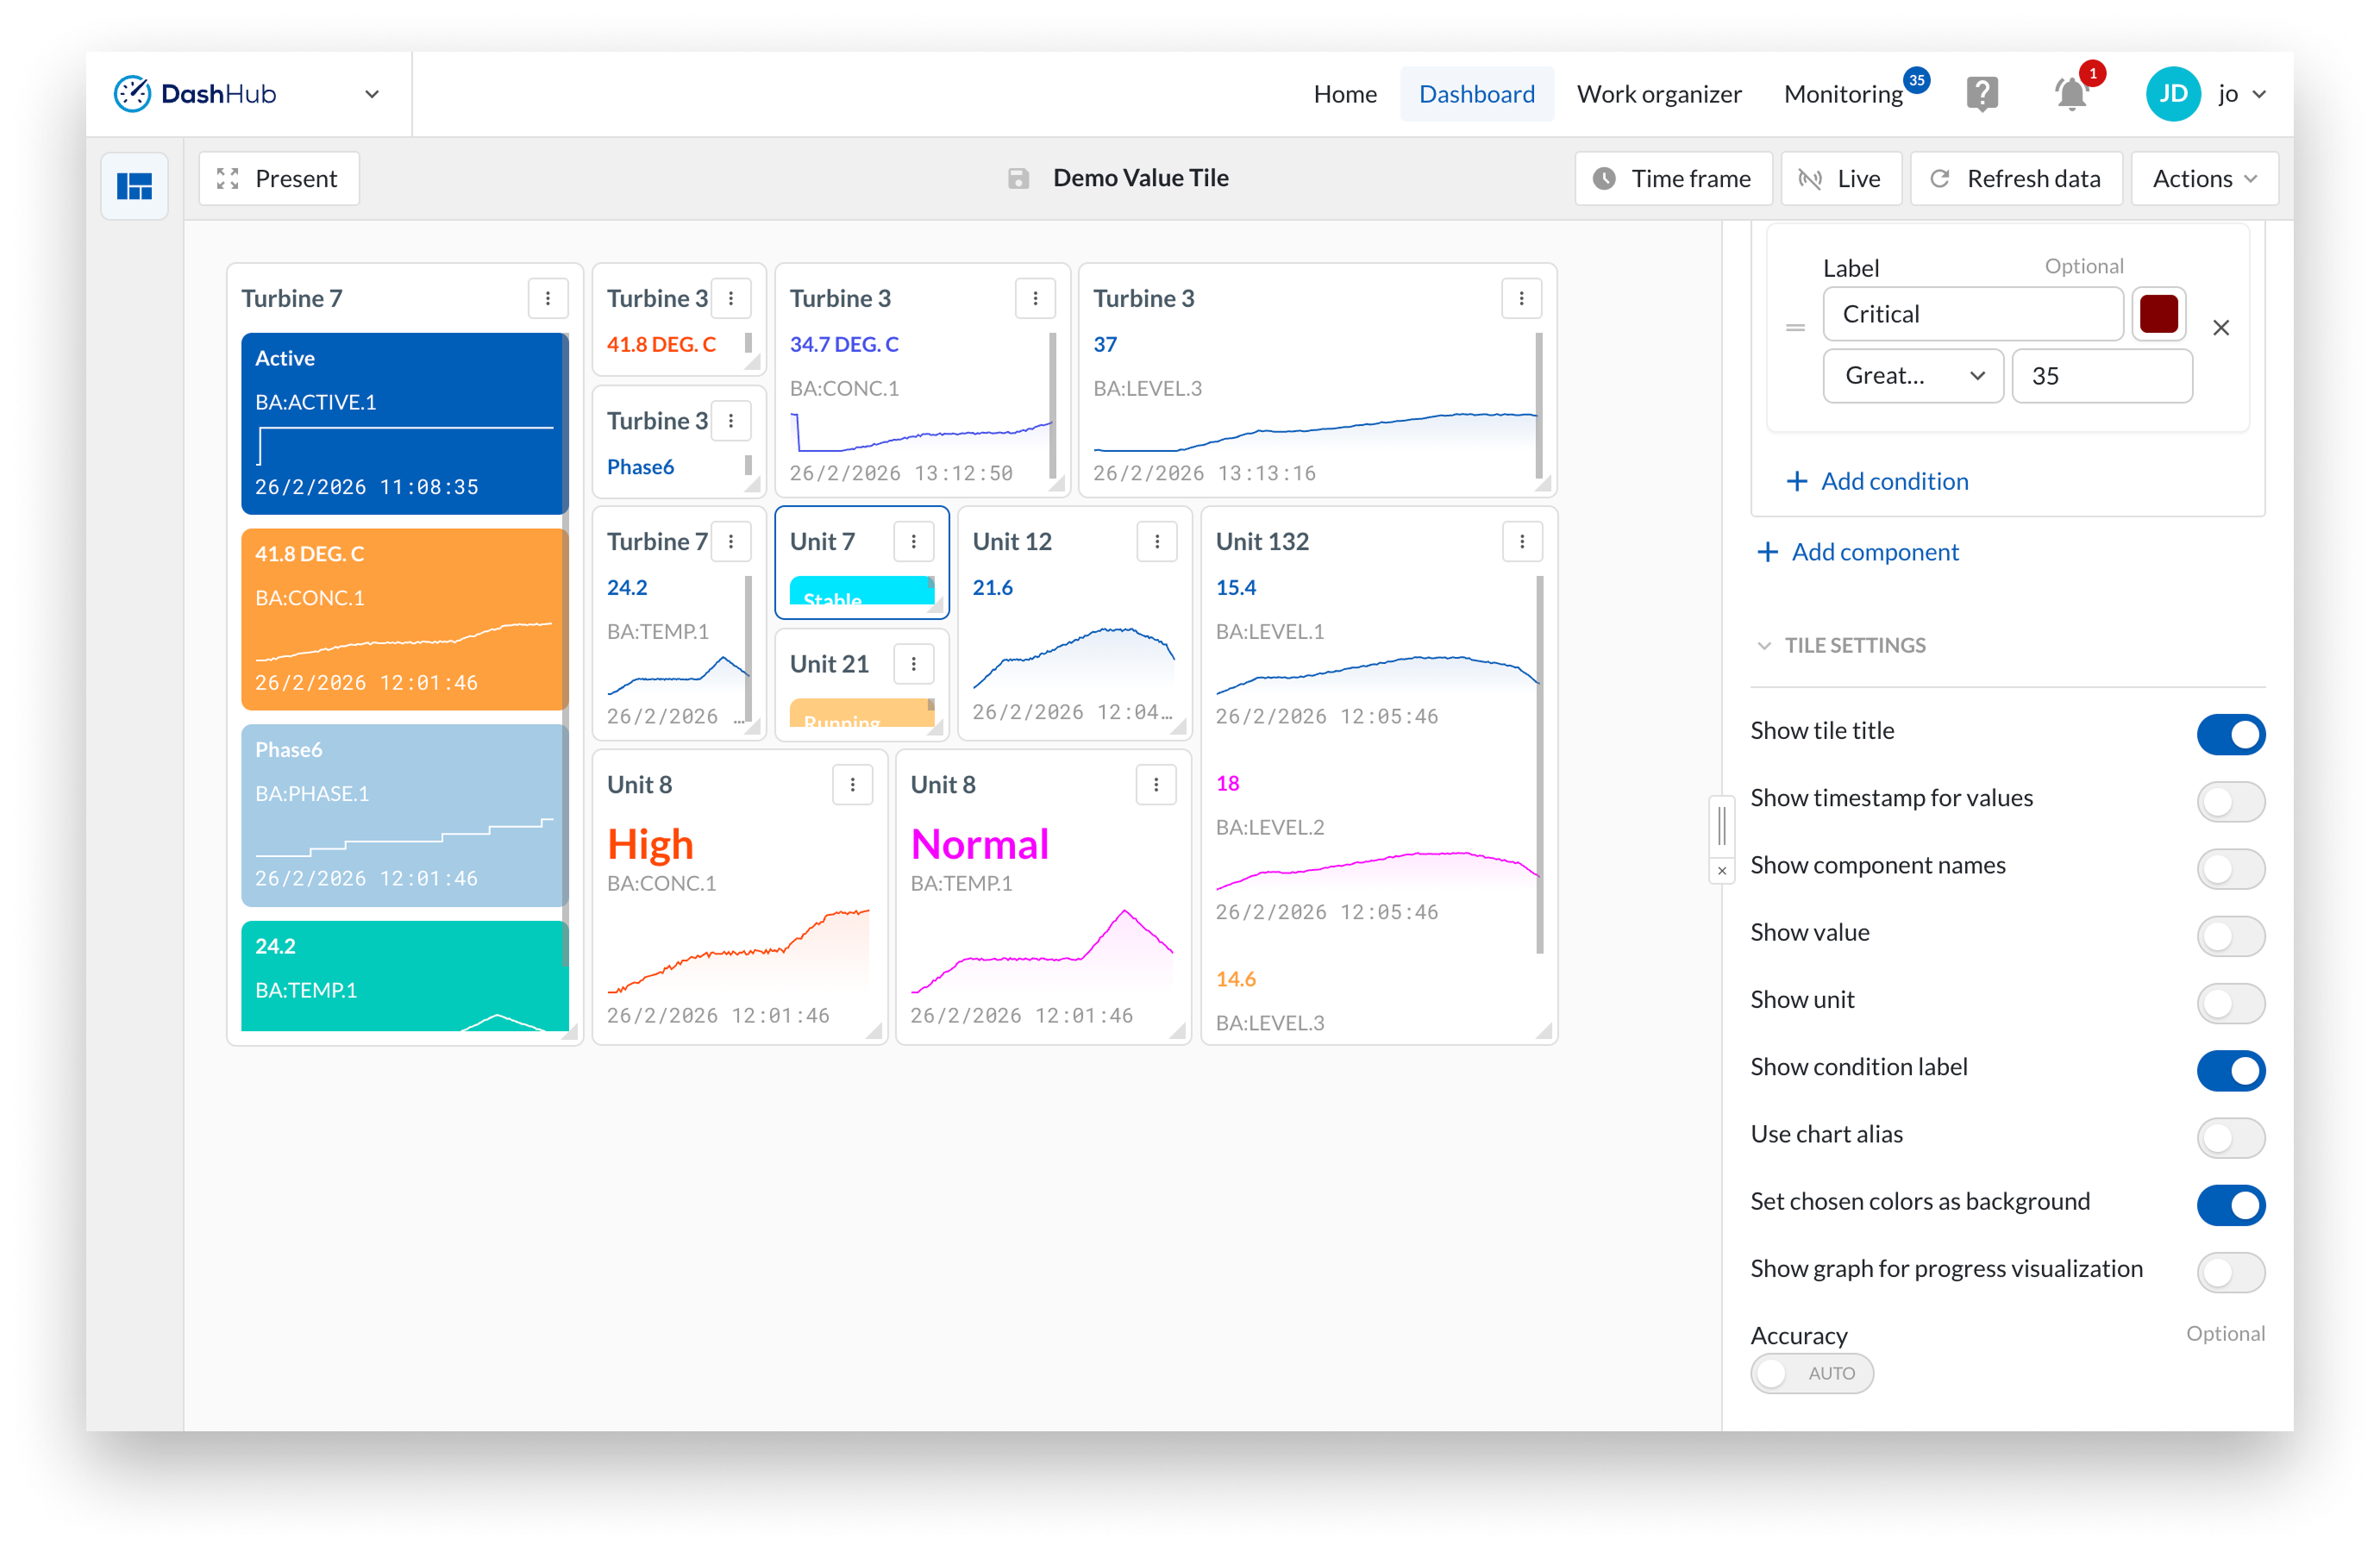
Available tile settings:
Show tile title
Show timestamp for values
Show component names
Show value
Show unit
Show graph for progress visualization
Set chosen colors as background
Start a new or open an existing dashboard.
Select "Add tiles" to create a new tile. You can add it to the dashboard by either dragging the tile or double-clicking it.
A side panel appears from the right side of the screen.
Add a title of your choice. By default, it takes the name of the first component.
Click Add component to select at least one or more components. You can add up to 15 components per value tile.
Each component has an unconditioned state by default but can have multiple conditions added by clicking the Add condition button.
Conditions let you highlight a component's current value based on defined rules. If a condition is met, the corresponding color is applied. You can add multiple conditions, and only the first matching condition is used. The first option is always Unconditioned, which means its color is applied by default or when no other conditions are met.
For each condition you can configure a color and an optional label.
The color is applied as the background or text color when the condition is met.
The label is a text shown on the tile when the condition is met, such as "High", "Offline", or "Out of spec". It can be shown instead of or alongside the raw value.
For analog and discrete tags, you can use the following conditions: greater than, greater than or equal to, less than, less than or equal to, equal to, not equal to, between, and not between.
For digital and string tags, the available conditions are: equal to, not equal to, contains, and does not contain.
Tile settings
The tile settings let you control what is displayed on the tile. You can choose to show or hide the numeric value, the unit, and the progress graph, allowing you to create anything from a compact status indicator to a detailed readout. Additional settings let you toggle the tile title, component names, and the timestamp of the most recent value.
You can find a complete overview of the available settings for the current value tile on the tile configuration pages.