Tile Configuration
Tile configuration allows you to customize each individual tile. It includes common settings such as the tile title and, depending on the tile type, a data field that can be set to a TrendHub view, a context view, monitors, or other components. Additionally, each tile type offers specific configuration options tailored to its use case.
In edit mode, you can manage an individual tile’s configuration by clicking directly on the tile or selecting "Edit" from the dropdown menu accessed via the three-dot icon.
Furthermore, you can manage the tile’s visualization through tile settings. Below, you will find an overview of the available settings. The refresh settings, accuracy, or even the time span for the graph can also be adjusted.
Tile settings
Tile settings give you control over what information is displayed and how it is presented for each tile. Some settings are universal across all tiles, while others are tailored to specific use cases.
Tile Settings | Current value | Monitor / Alert | TrendHub view | Context view | Text | External content | Gauge |
|---|---|---|---|---|---|---|---|
Show tile title | x | x | x | x | x | x | x |
Show timestamp for values | x | x | |||||
Show component names | x | x | |||||
Show value | x | ||||||
Show unit | x | x | |||||
Use chart alias | x | x | |||||
Show graph for progress visualization | x | ||||||
Set chosen colors as background | x | x | |||||
Show context items | x | ||||||
Show time frame | x | x | |||||
Show legend | x | x | |||||
Show range label | x | ||||||
Show ticks | x | ||||||
Show target difference | x | ||||||
Color value as range color | x | ||||||
Display value as percentage | x | ||||||
Display ranges as percentage | x | ||||||
Display target difference as percentage | x |
Show timestamp for values: Include the timestamp for the retrieved value(s).
Show component names: Show the component name(s), if applicable for the value or the view.
Show value: Show the value of the component.
Show unit: Show the value unit of the component.
Use chart alias: Use the chart alias instead of the component name.
Show graph for progress visualization: Enable a graph for progress visualization, ideal for current values.
Set chosen colors as background: Use the selected colors to highlight specific conditions or statuses as the tile's background.
Show context items: Show the corresponding context items on the view.
Show time frame: Display the time frame of the view or data, similar to the timestamp.
Show legend: Include the legend, useful in cases like scatter plots (e.g., "Oldest to newest").
Show range label: Displays the label of the range that the current value falls within.
Show ticks: Displays tick marks.
Show target difference: Displays the difference between the current value and the target value on the gauge.
Color value as range color: Colors the current value using the same color as the range it falls within.
Display value as percentage: Shows the current value as a percentage of the maximum value.
Display ranges as percentage: Displays the ranges on the gauge as percentages of the maximum value.
Display target difference as percentage: Shows the difference between the current value and the target as a percentage of the target or maximum value.
Other settings
Time span for graph: Define the time span for the historical data used to build the progress visualization graph. You can increase the time span of interest up to 8 hours.
Accuracy: Override the automatic accuracy to control how many digits are shown after the decimal point. You can enter a value like 10⁻ᴺ, where N is the number of decimal places, or leave it set to auto.
Refresh settings: Set the interval for retrieving data updates. By default, the context view tile and the TrendHub view tile refresh every 5 minutes, while the monitor tile and the current value tile refresh every 1 minute.
The "Use chart alias" option allows you to display an alias instead of the component name. This is useful when the component name is not descriptive enough for the value shown in the tile.
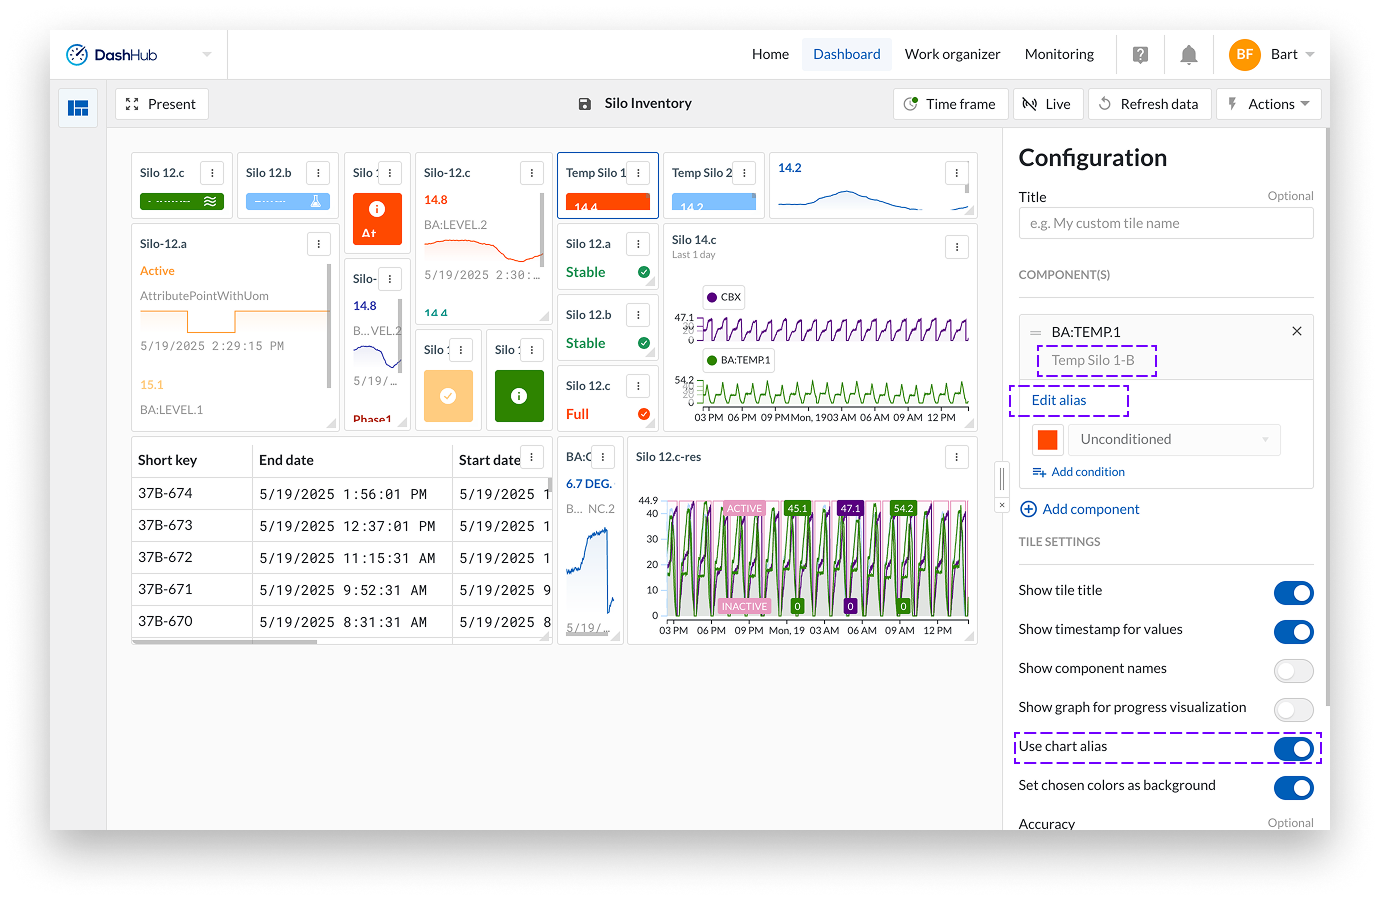
You can set a chart alias on any tile that includes a component. Click Edit alias under the component, then enter your preferred alias in the popup that appears. The alias will also be shown below the component name in the configuration.
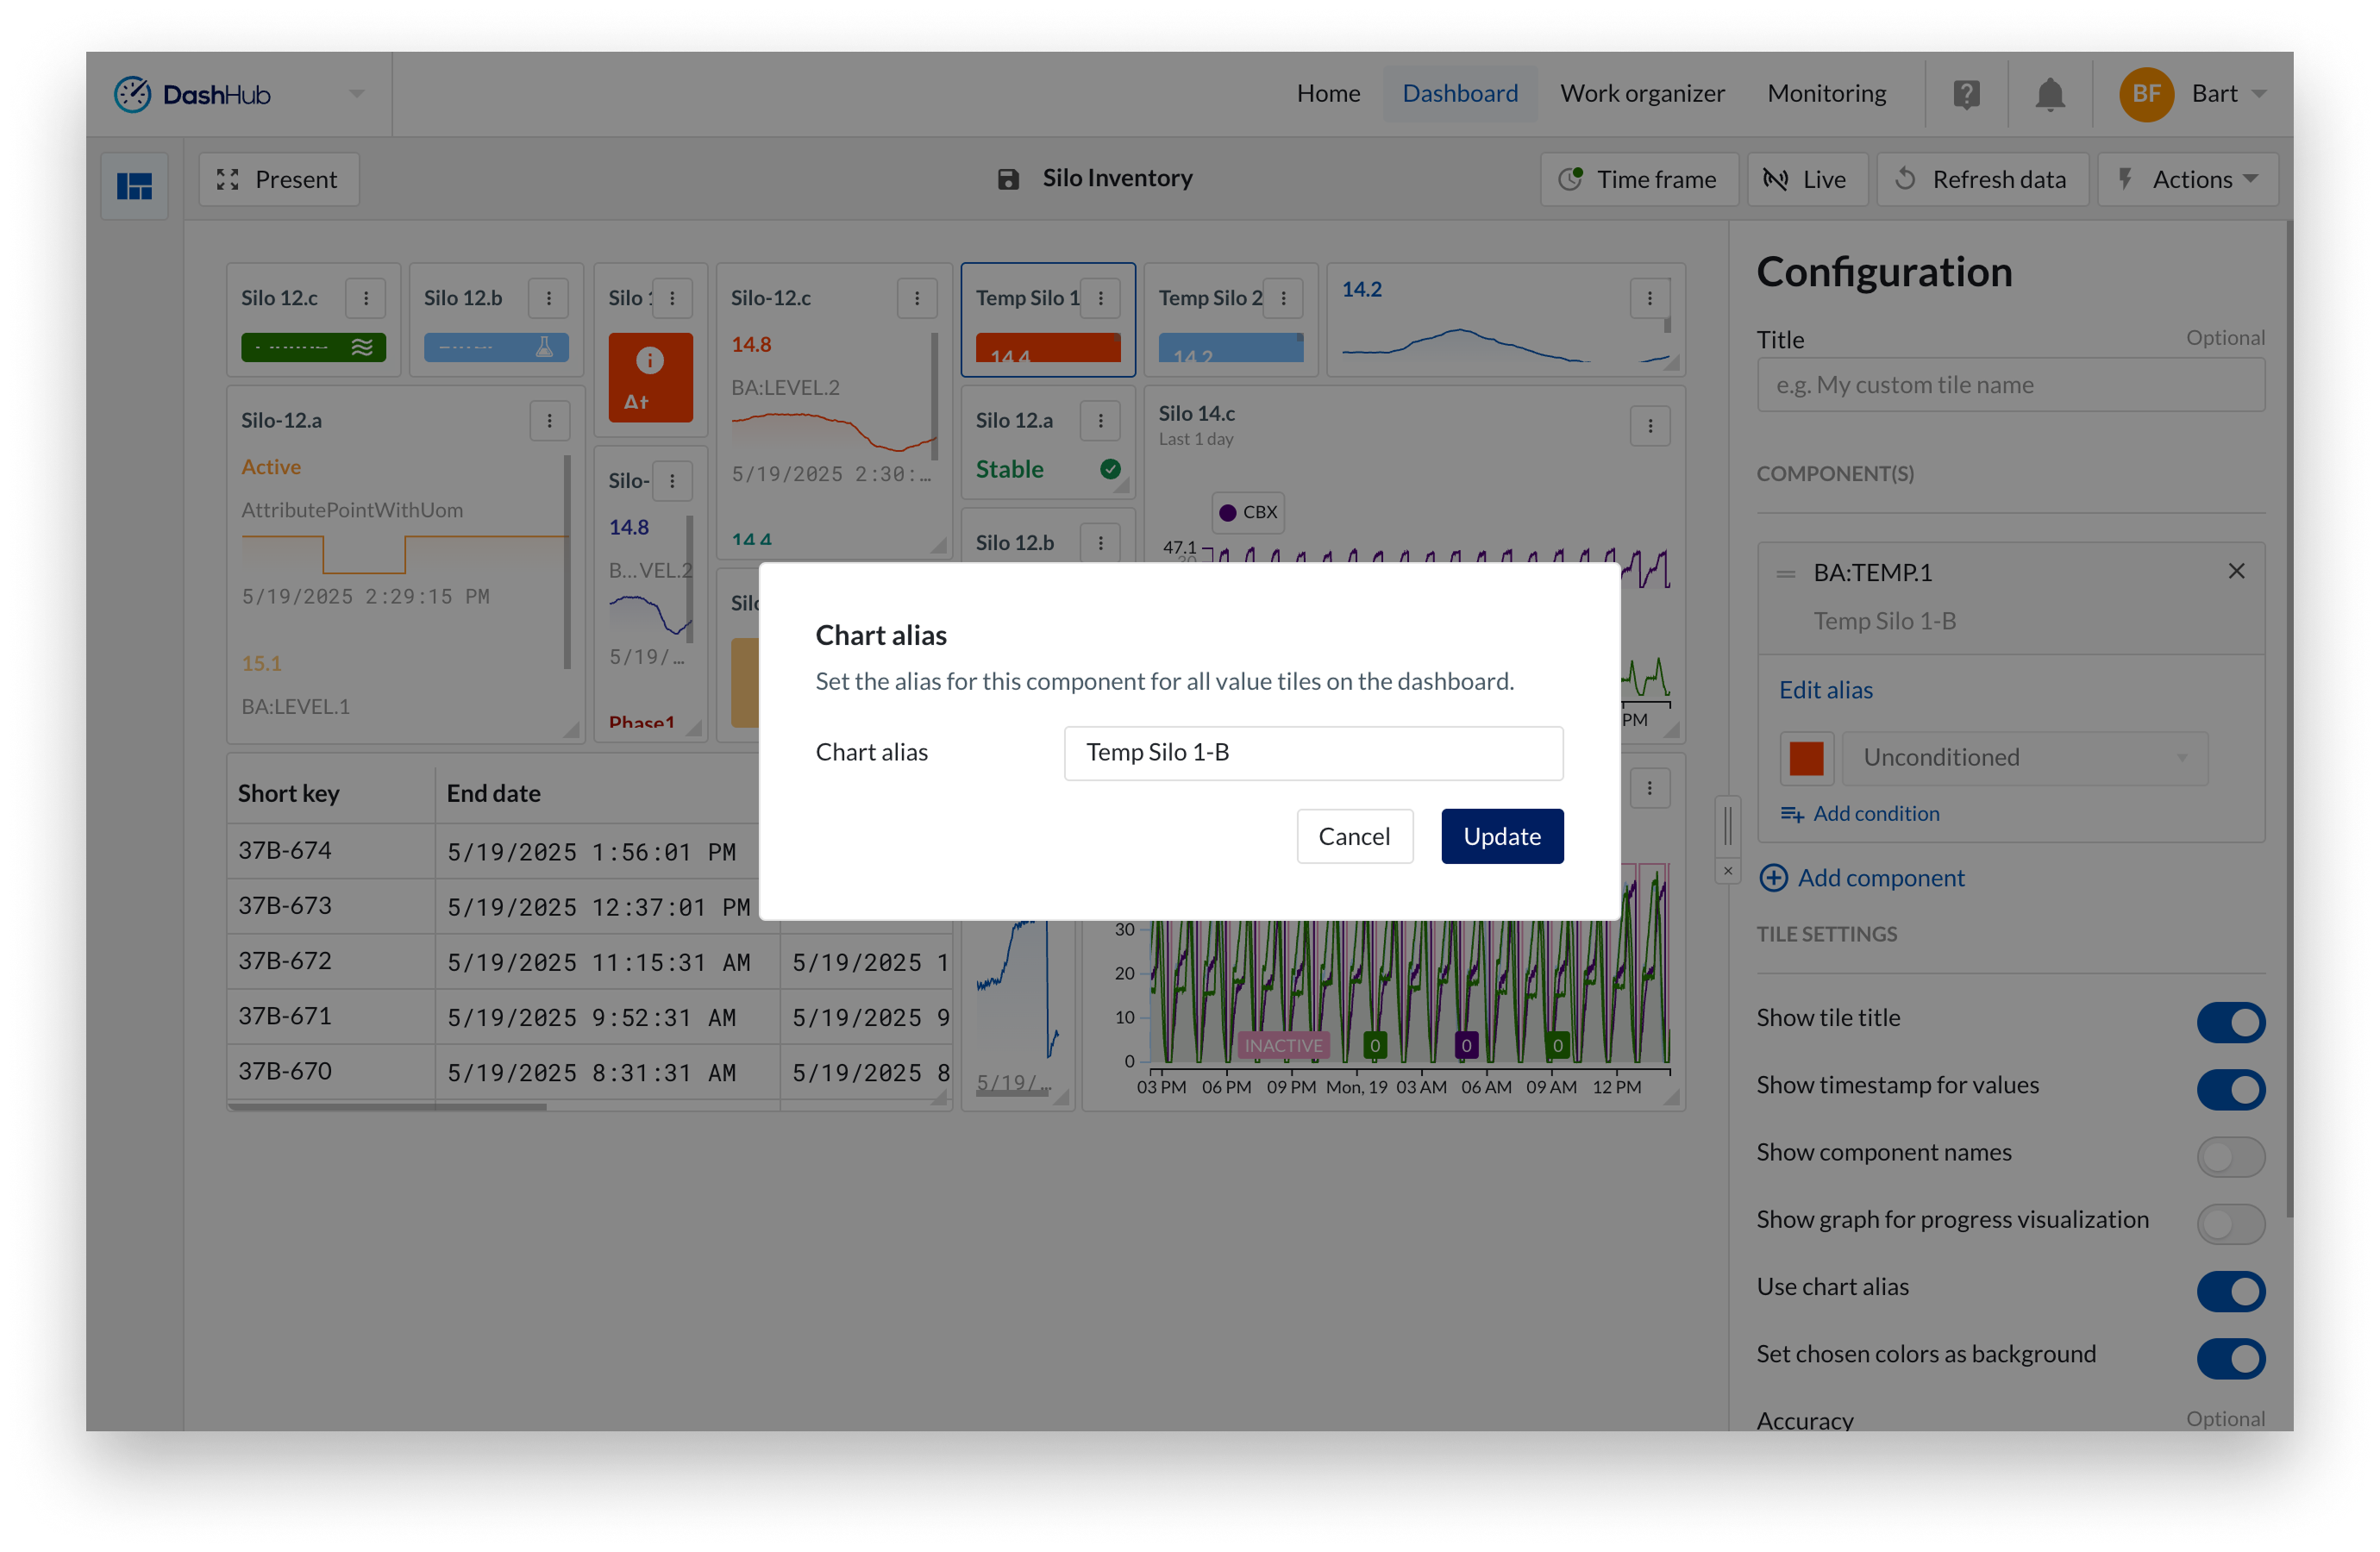
The alias is applied everywhere the component is used in tiles on the dashboard. Your change will be reflected across all relevant tiles, except for the TrendHub Tile and Context View Tile. These always use the settings defined in the original view.
By adjusting tile settings like "Show component names" and leaving the tile title empty, you can display the alias in different ways across the tile.
The chart alias is saved with the dashboard, and also stored in your user preferences. The next time you use this component in a dashboard, the alias will be filled in automatically. If you edit the alias again, it will update your user preferences.
DashHub uses a flexible 24-column grid system to organize and position tiles. This layout ensures consistency, alignment, and an intuitive visual design, while still giving you full control over how tiles are arranged.
To keep dashboards readable and functional, tiles have minimum sizes. These limits ensure content remains clear.
2x2 minimum: Text, context count, alert, value, gauge tiles
4x2 minimum: TrendHub plot, external content, notebook, statistics table tiles
6x2 minimum: Context table, context gantt, context scatter tiles