Getting rid of spikes in sensor data
When performing analyses, it's important to pre-process data in order to get good results. One such example is getting rid of spikes in sensor data. Four different ways are shown here to get rid of said spikes and get the results you are looking for.
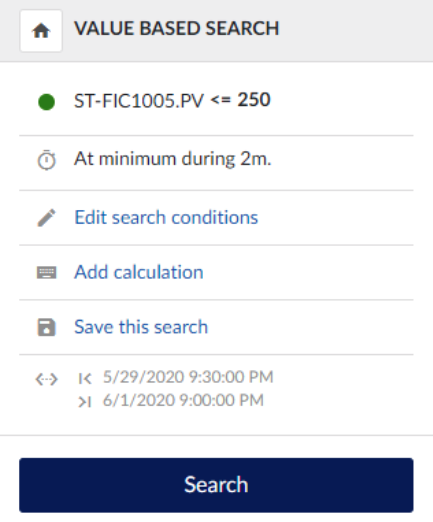
Perform a value-based search to look for values smaller than the spikes.
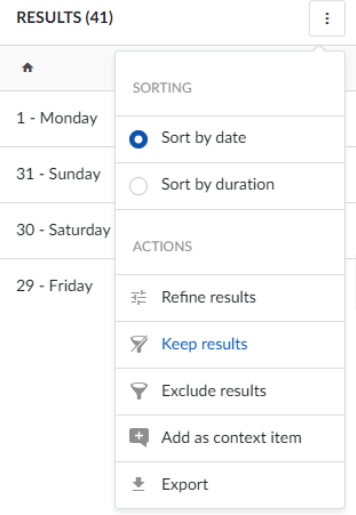
Keep results to exclude the spikes.
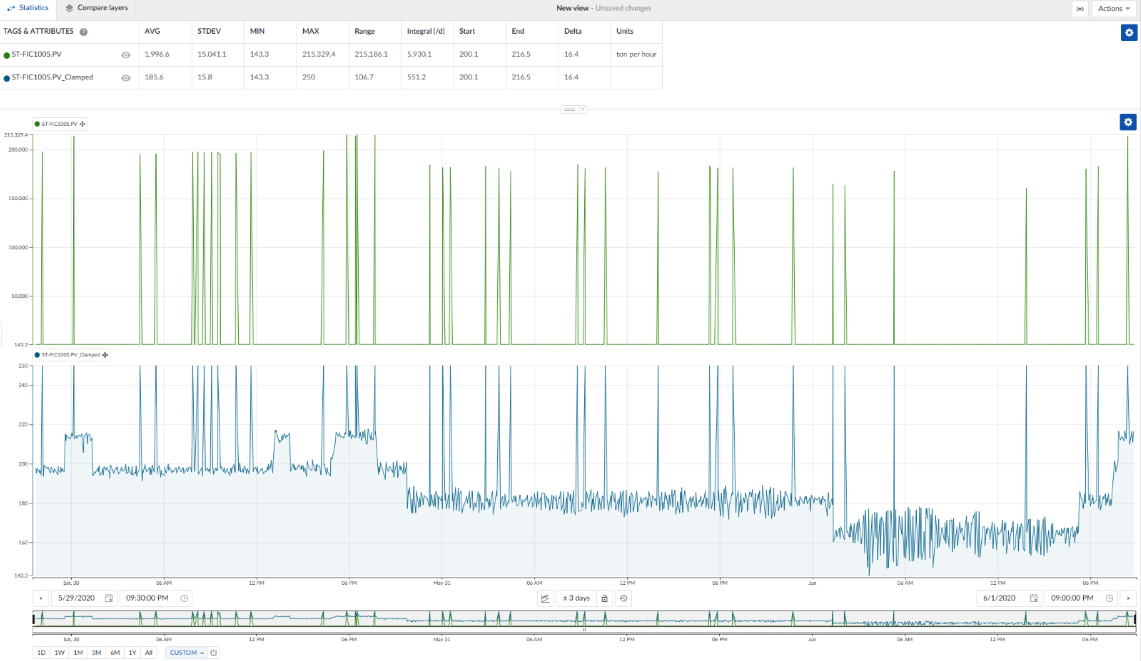
When looking at the statistics table, the values are now displayed without considering the spikes.
 |  |

Advantages: Quick & Easy
Disadvantage: Less flexible for next steps
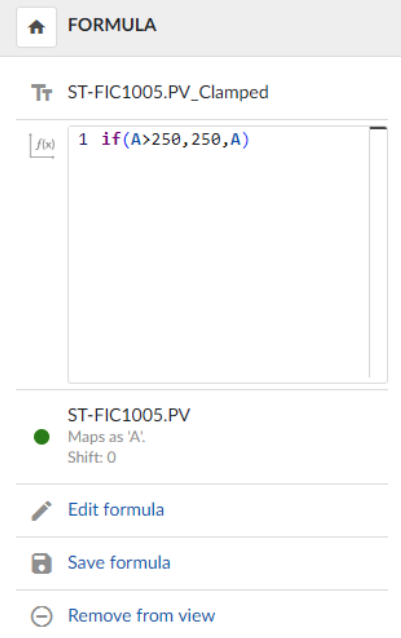
Create a formula to over clamp the spikes to a lower value (threshold for maximum of spikes).
if(A>250,250,A)
Variable mapping:
A = Original tag with spikes
When looking at the statistics table, the values are now displayed with an upper limit for the spikes.
Advantages: Simple concept, Flexible
Disadvantage: Small loss of accuracy
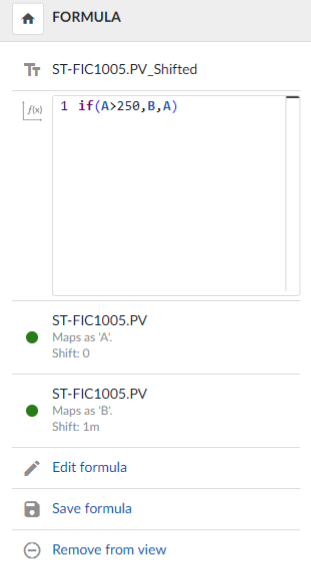
Create another formula to use the last good point as a reference point.
if(A>250,B,A)
Variable mapping:
A = Original tag with spikes
B = Original tag with spikes, shifted by 1 minute
When looking at the statistics table, the values are now displayed precisely.
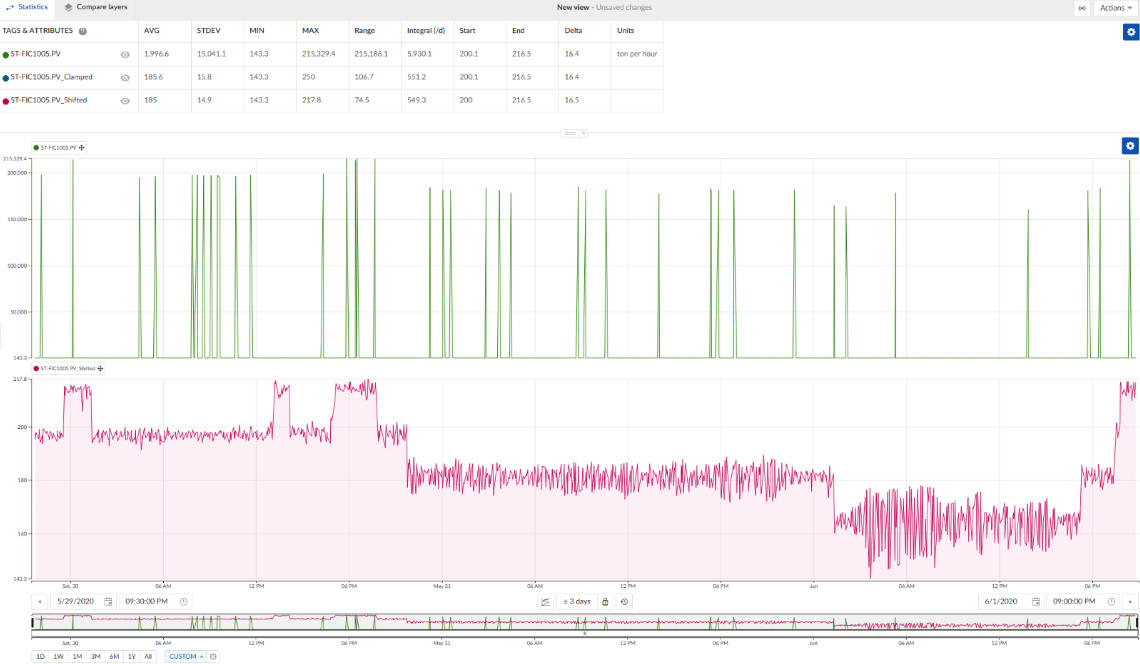
Advantage: Accurate
Disadvantage: May require fine-tuning
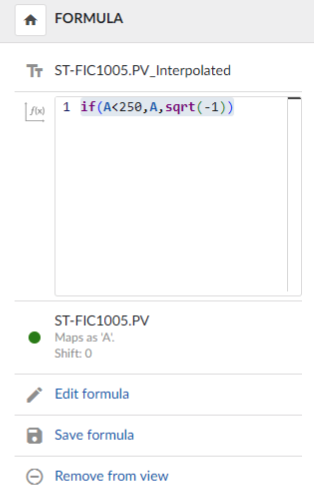
Create a formula to linearly interpolate between the start and the end value of an interval when the if-condition is not true.
if(A<250,A,sqrt(-1))
Variable mapping:
A = Original tag with spikes
When looking at the statistics table, the values are now displayed precisely like in option C.
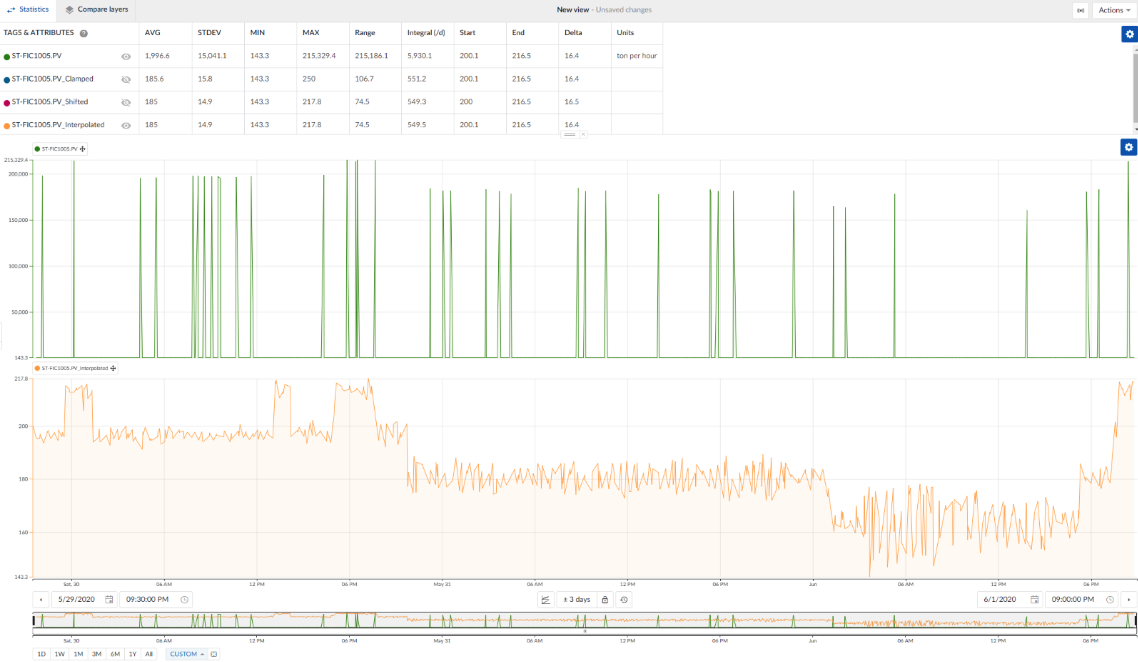
Advantage: Accurate
Disadvantage: May require fine-tuning