Getting started [2/5] - Tags and views
TrendHub helps you analyze time series data; think of process measurements such as temperatures, pressures and valve states. We refer to these measurements as tags. Tags are brought together and visualized in TrendHub views which give you a window to your process behavior.
Learn how to search for, add, and visualize tags, and save your views for future access in the following video. Next, continue on this page to learn more...
Utilizing scatter plots, layers & live mode
Scatter plots enable you to visualize correlations between measurements, and identify different operational regimes in your process. Learn more
Layering is a mechanism that will help you to visually compare data on the focus chart. Comparing similar events for different timeframes or operating conditions, enables you to troubleshoot and further understand your process. Learn more
Entering live mode enables you to visualize data as it arrives in real-time. This allows you to follow a process or to visually compare process data with fingerprints to assess process conditions. Learn more
Put your TrendMiner knowledge into practice!
1. Comparing processes 1 minute | 2. Recent process behavior 1.5 minutes | 3. Frequently used tag sets 2 minutes |
|---|---|---|
Next step: Build your own tags

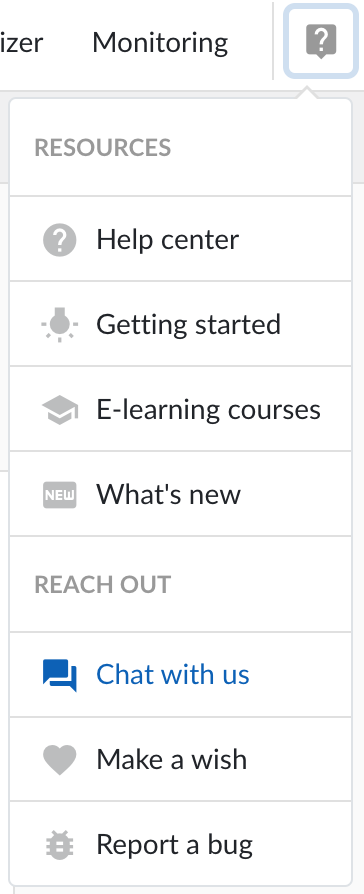
Need some more support? Check the Help menu in the TrendMiner top bar to get access to our support resources. Browse through the documentation in our Help Center, explore the Getting started guides or click 'Chat with us' to get direct help from a TrendMiner expert!