Event analytics
Notice
Event analytics replaces the search result Refinement option.
Event analytics allows you to analyze search results based on aggregated values of each search result. The duration, or score (in case of a similarity search) of each result is combined with the defined calculations on top of search results and can be presented in different visualizations.
The visualization modes can be used to provide ad hoc insights by evaluating how selections in one metric are reflected in others, which allows you to test hypotheses or find possible root causes. Selec- tions are automatically applied on all visualization modes enabling you to switch between the different visualization modes based on their needs. Selections can also be applied on the search result list by clicking "Refine". This will update the search result list based on selected event analytics variables, after which you can continue your analysis based on a subset of the results.
Event analytics pane
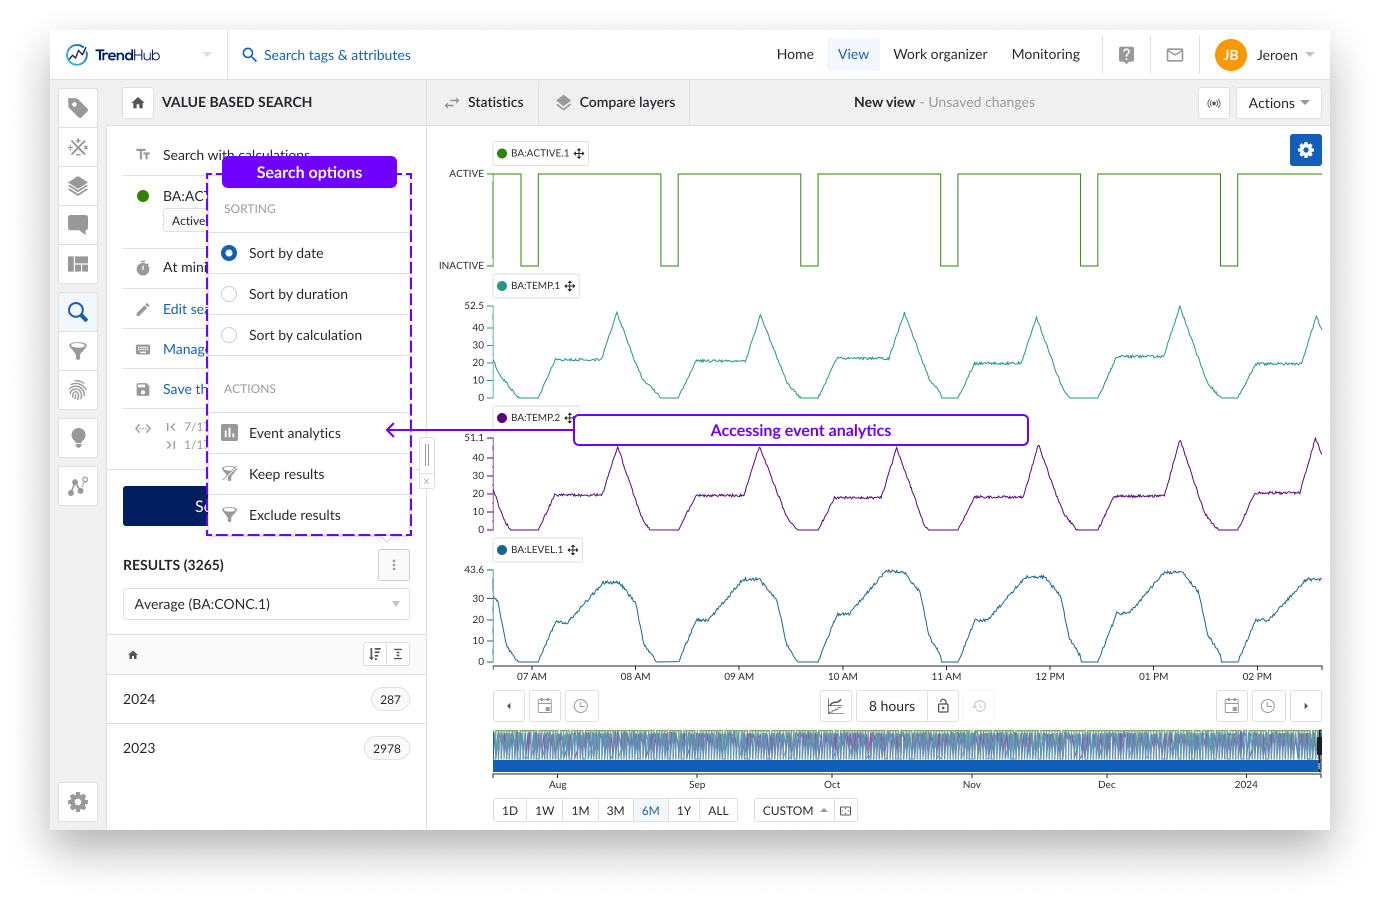
The event analytics pane can be accessed through the search result option menu.
When the event analytics pane is opened, the search result list is disabled. The event analytics pane can be closed by using the "Close" button or the "Refine" button. Switching menus will also automatically close the event analytics pane. On re-opening, selections will be re-applied based on the active refinements. Ad hoc selections will not be remembered when closing the event analytics pane.
The event analytics feature provides 2 different modes of visualization:
Histograms (1 histogram per metric)
Parallel coordinates plots
By default, the analytics pane will open on the Histograms tab. When repeatedly opening and closing the event analytics pane, the last accessed tab will be remembered. Re-executing a search will act as a reset after which the histogram tab will open as default.
The reset button in the header of the event analytics pane will reset all applied selections on the histograms and parallel coordinate plot.
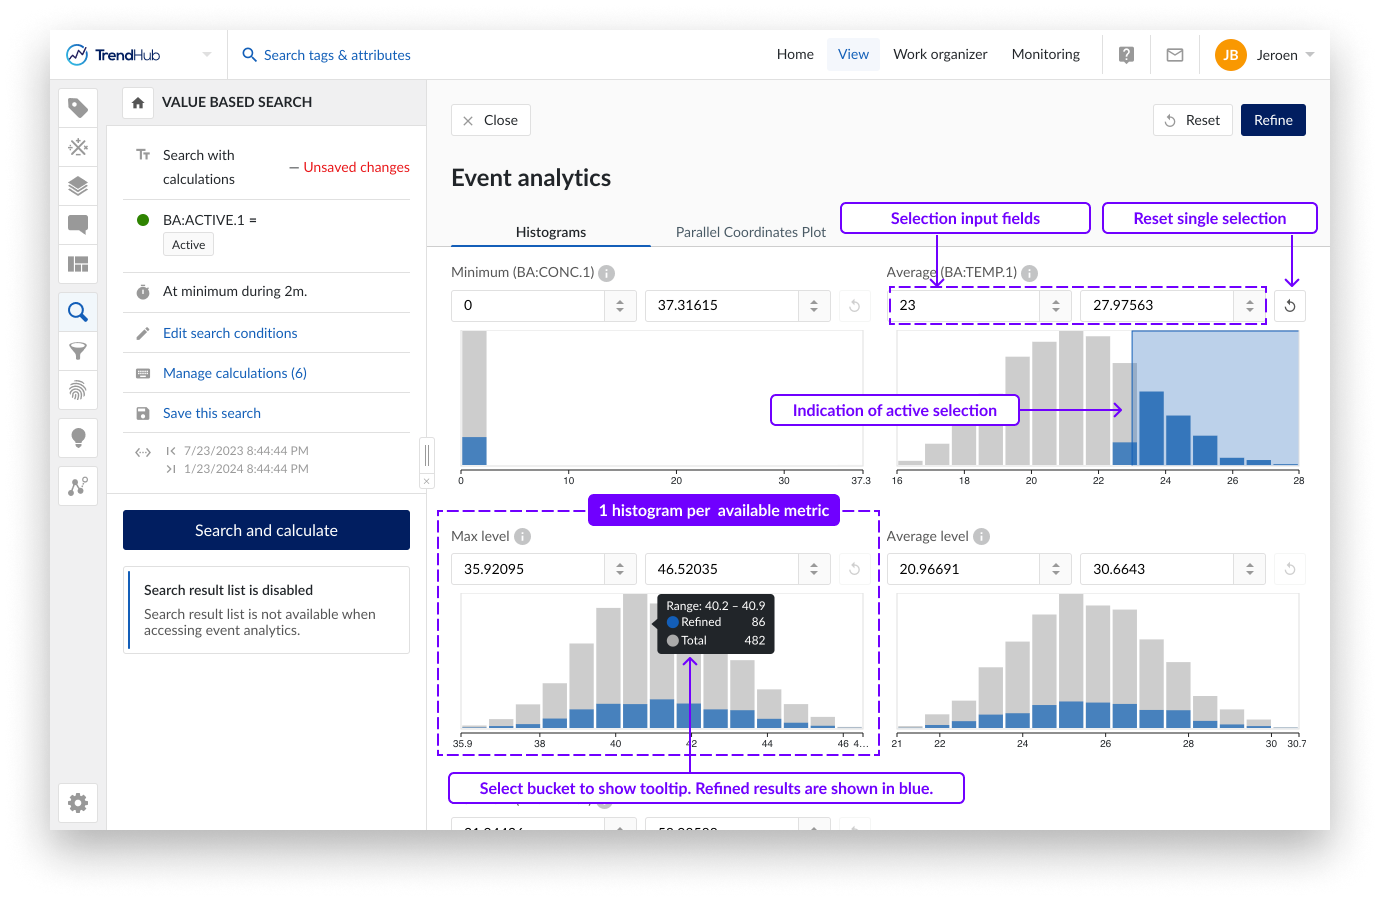
Histograms
The histogram tab provides a visual representation of the data distribution for all calculations on analog or discrete tags as well as the duration of search results or the similarity score. Hovering over a single bucket provides information on the ranges of each bucket, as well as the total number of results residing within this bucket.
A subset of the data can be chosen by selection on histograms or by setting the ranges manually in the numeric input fields. Histograms with active selections can be identified by the blue shaded area. When selecting subsets, the remaining results are indicated in blue and reflected on all histograms. The number of refined results is also indicated in the tool tips.
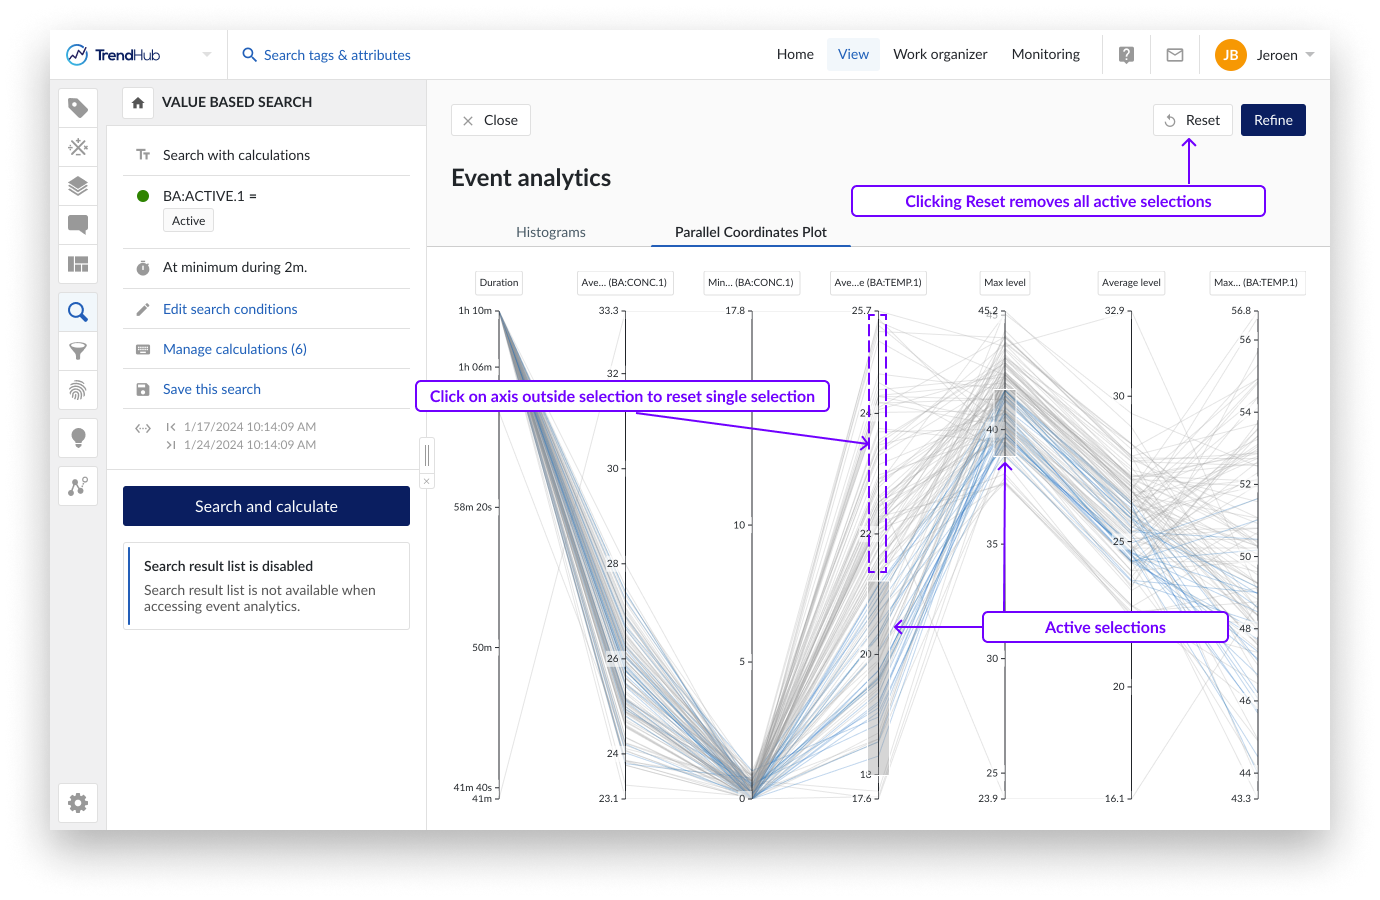
Parallel coordinates plot
A parallel coordinates plot is a graphical method used for visualizing multivariate data. In contrast to the histogram visualization, the parallel coordinates plot shows every single search result. It consists of parallel axes, one for each metric (duration, similarity score and calculations on analog or discrete tag) and lines connecting the different axes. One blue, continuous line represents one search result. This type of plot is particularly useful to understand the relationships and trends within the search results. Look for patterns such as convergence, divergence, or parallelism of lines. These patterns can reveal correlations, clusters, or outliers in your data.
Calculations based on string or digital tags are not visualized on an axis but can be used to color the lines based on specific string values. See the section below for more details.
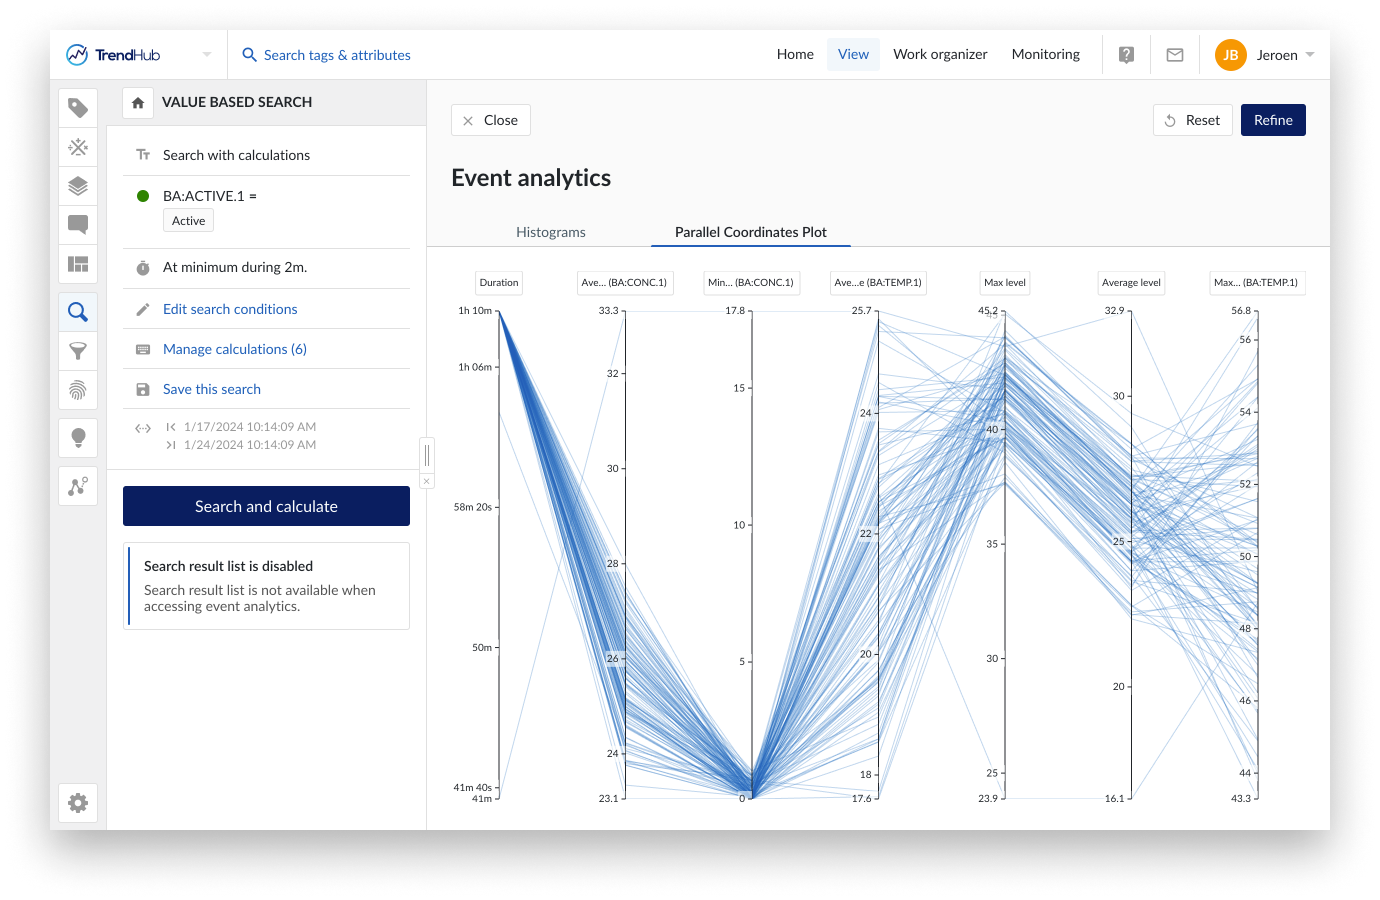
By default, the axes will be ordered as defined by the order of the calculations. You can move them to any location of preference by dragging the axis label. Swapping the direction of the axis is possible by clicking the button underneath an axis. These modifications are remembered within the current analysis. As soon as the search is re-executed, all these modifications are reset.
Caution
A search result is only visualized on the parallel coordinate plot if all calculations have values. In the case that one of the calculations does not have a value (e.g. due to missing indexed data or infinite values), the complete search result will be omitted from the plot. This is a key difference to the histogram visualization.
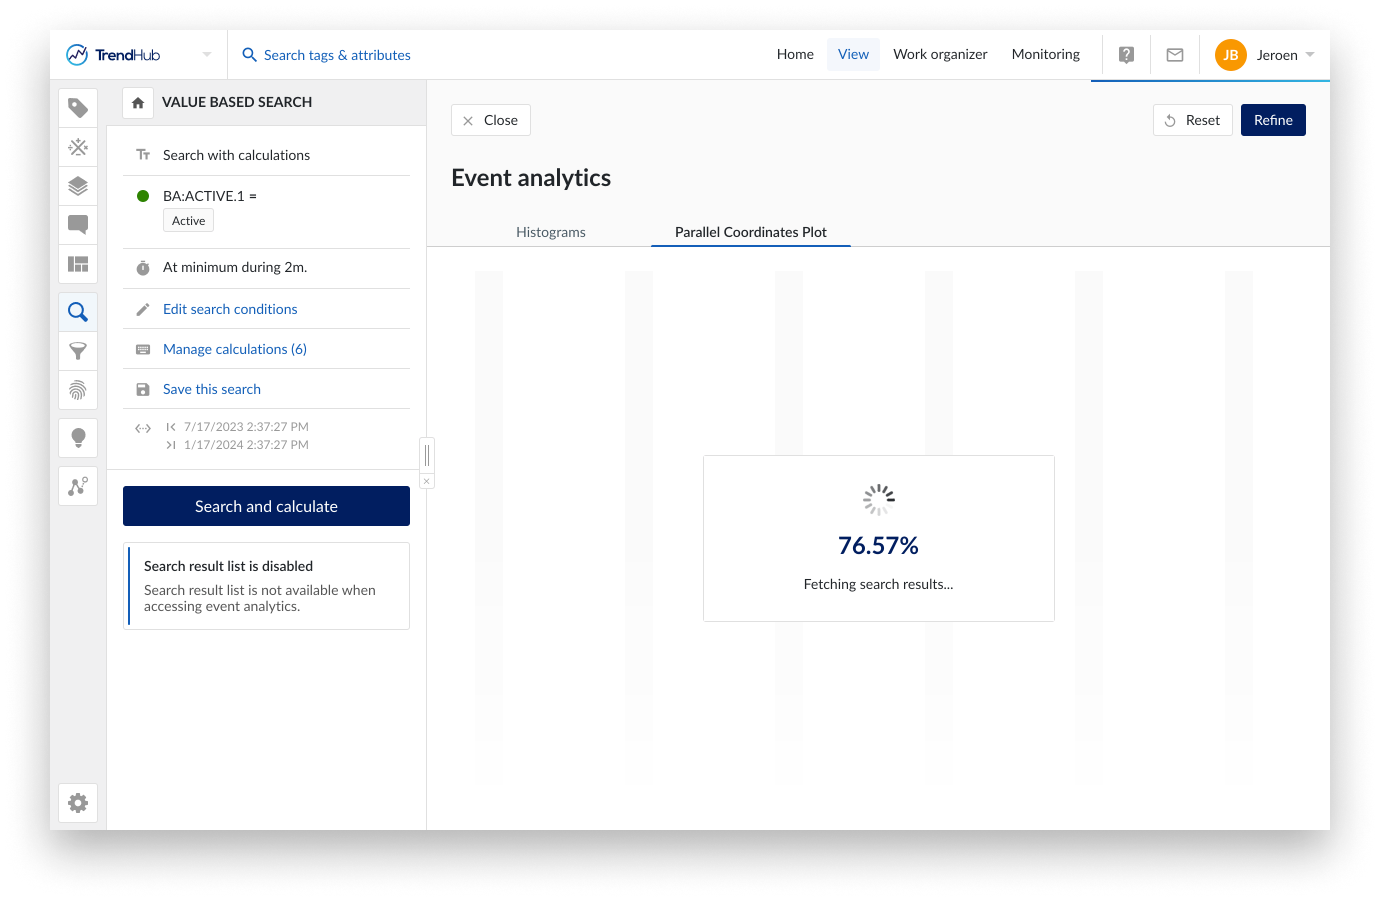
Since all results will be shown as single data points, the initial rendering of the plot can take time. A loading screen will be shown while fetching the data.When complete, the graph is displayed. At this point you can switch between the histogram and parallel coordinates plot tab.
A subset of the data can be chosen by selecting on an axis (this is “brushing”). Remaining results are visualized in blue. Selections can be made on different axis to combine different criteria. By clicking on the axis outside the selected region, the selection is removed. Clicking the "Reset" button at the top right, removes all selections.
Switching between tabs
When executing a search, and opening the event analytics frame, the Histogram tab will be displayed by default. Applied (ad hoc) selections will be transferred when switching between the tabs. This allows you to iteratively select and analyze your data based on the visualization mode which is most suitable at any given point. As long as the search is not re-triggered, the event analytics pane will open in the most recently viewed visualization mode.
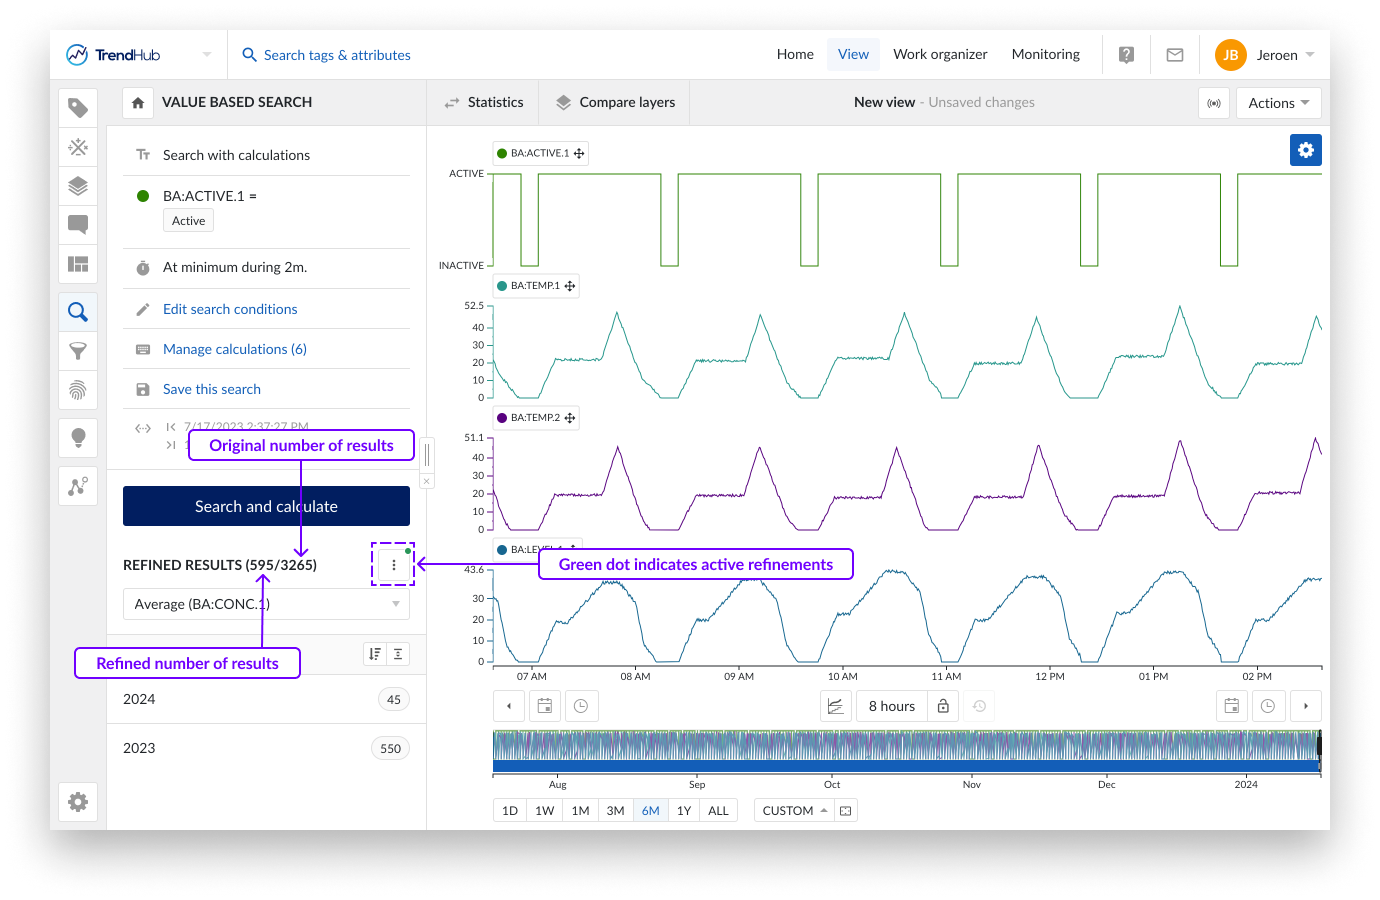
Refining results
The event analytics visualization can be used for ad hoc analysis or to further refine the search result list. Click "Refine" in the top right corner, to transfer the ad hoc selections to the search result list.The search result list header will update to indicate both the number of refined results as well as the original total results. A green dot appears on the search options, indicating that the search result list has been refined. The set of refined results can now be used to continue your analysis in the time-series universe. The search result options, like filtering, creating context items, and exporting, will now only be applied on the refined results. See this article for more information on how to work with the search result list.
On re-opening the event analytics pane, selections will be re-applied based on the active refinements.
The number of bins for the histograms is set to a fixed value of 15 and cannot be adjusted.
No histogram can be shown if there is no variance in the resulting data.
Search refinements, as well as any applied configuration on the parallel coordinates plot are not saved and are reset after re-performing the search.