Display an aggregated value as a fixed value per day and in a value tile
This can be useful as it simplifies data interpretation and decision making by displaying a fixed daily aggregated value. In addition, presenting this information in the current value tile on a dashboard provides instant access to critical real-time data.
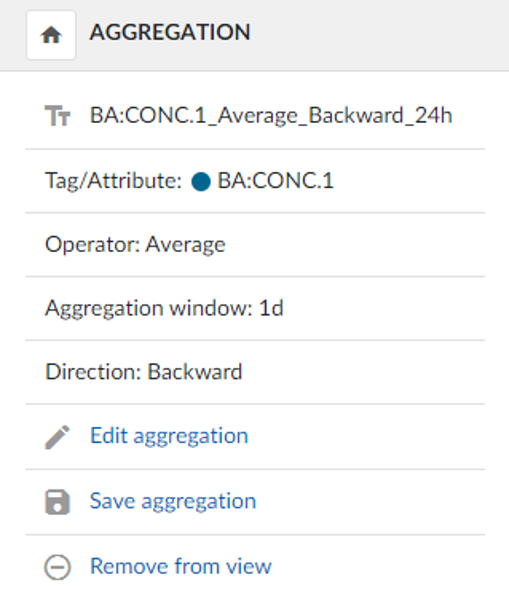
1. Create an Tag Builder Aggregation on a process tag of interest, with the most commonly used method being the calculation of the average.
Use the Tag Builder Formula to have a single data point every 6 hours.
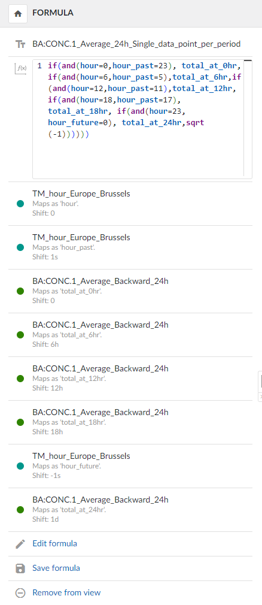
Formula:
if(and(hour=0,hour_past=23), total_at_0hr, if(and(hour=6,hour_past=5), total_at_6hr, if(and(hour=12,hour_past=11), total_at_12hr, if(and(hour=18,hour_past=17), total_at_18hr, if(and(hour=23,hour_future=0), total_at_24hr,sqrt(-1))))))
Variable mapping:
hour = TM_hour_* (according to time zone)
hour_past = TM_hour_* (according to time zone), shifted by 1s
total_at_0hr = Aggregated tag from step 1
total_at_6hr = Aggregated tag from step 1, shifted by 6h
total_at_12hr = Aggregated tag from step 1, shifted by 12h
total_at_18hr = Aggregated tag from step 1, shifted by 18h
hour_future = TM_hour_* (according to time zone), shifted by -1s
total_at_24hr = Aggregated tag from step 1, shifted by 1d
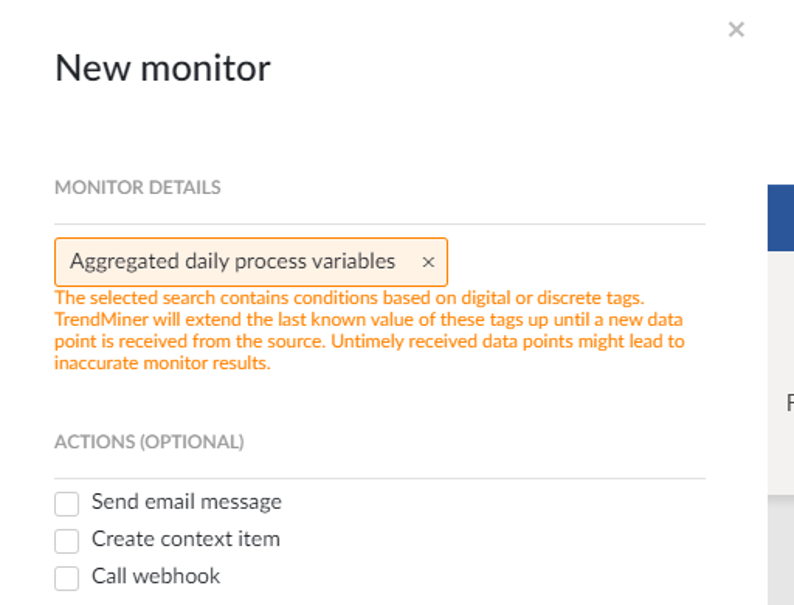
Perform a value-based search to search for aggregated daily process variables. A monitor can also be enabled if required.

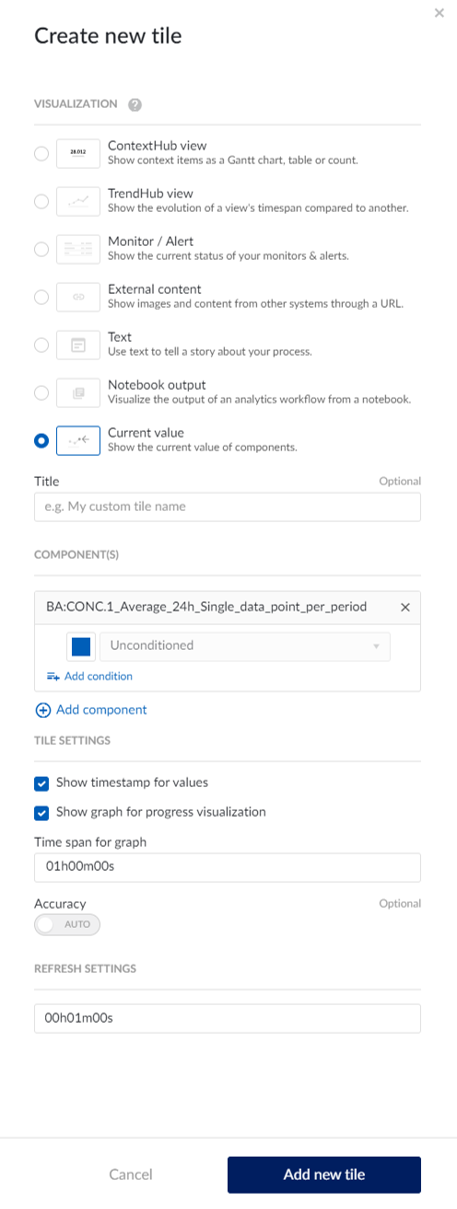
Create a dashboard with a current value and select the new formula tag as a component.