Exportation des données de TrendHub
Exportations
TrendHub propose différentes options pour exporter des données, qui peuvent être regroupées en 2 catégories :
Toutes les options d'exportation liées aux vues TrendHub se trouvent dans la liste des actions de la barre de vue.
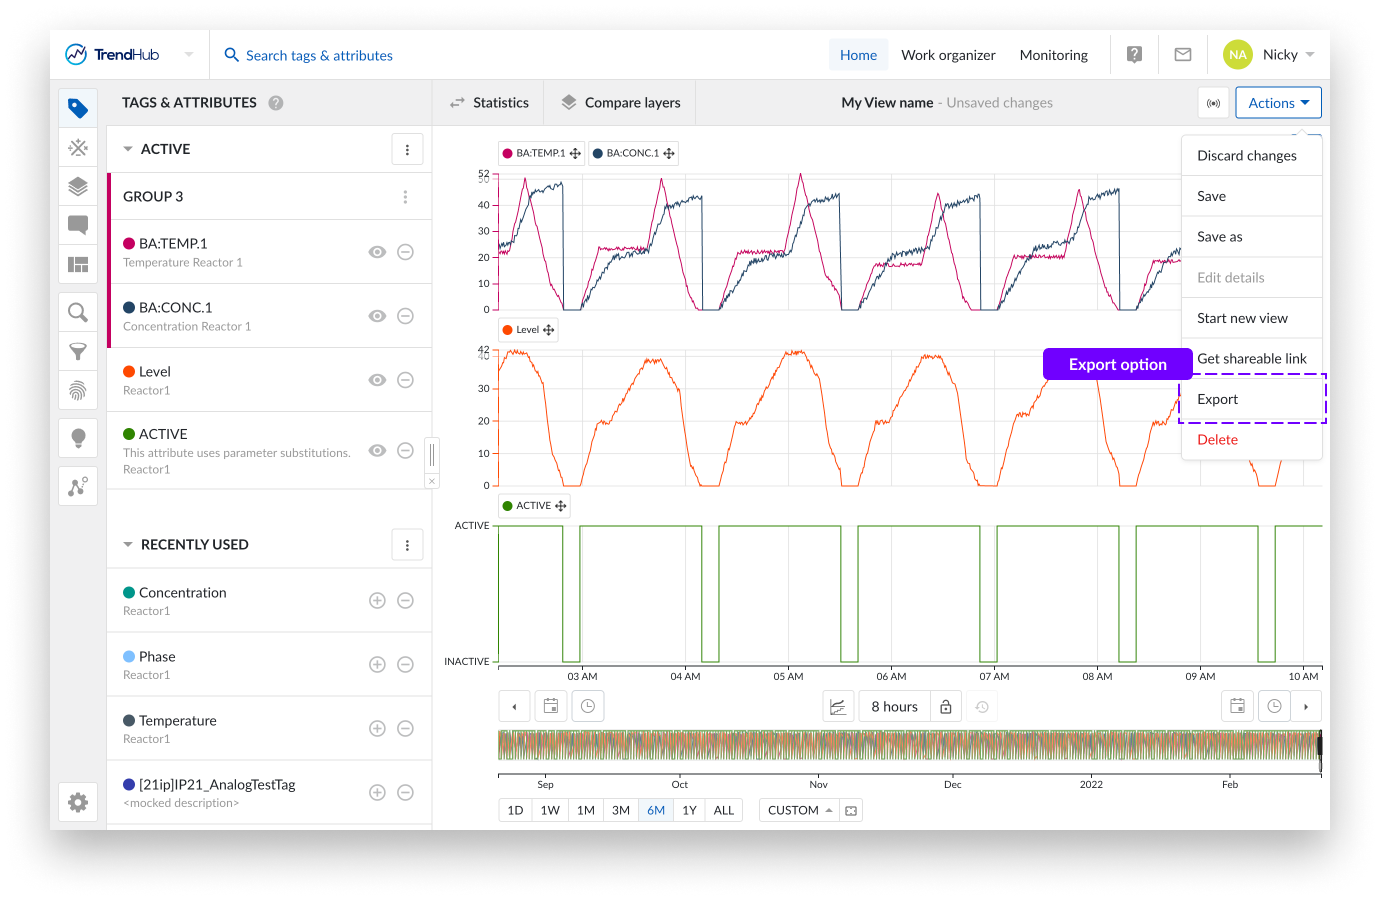
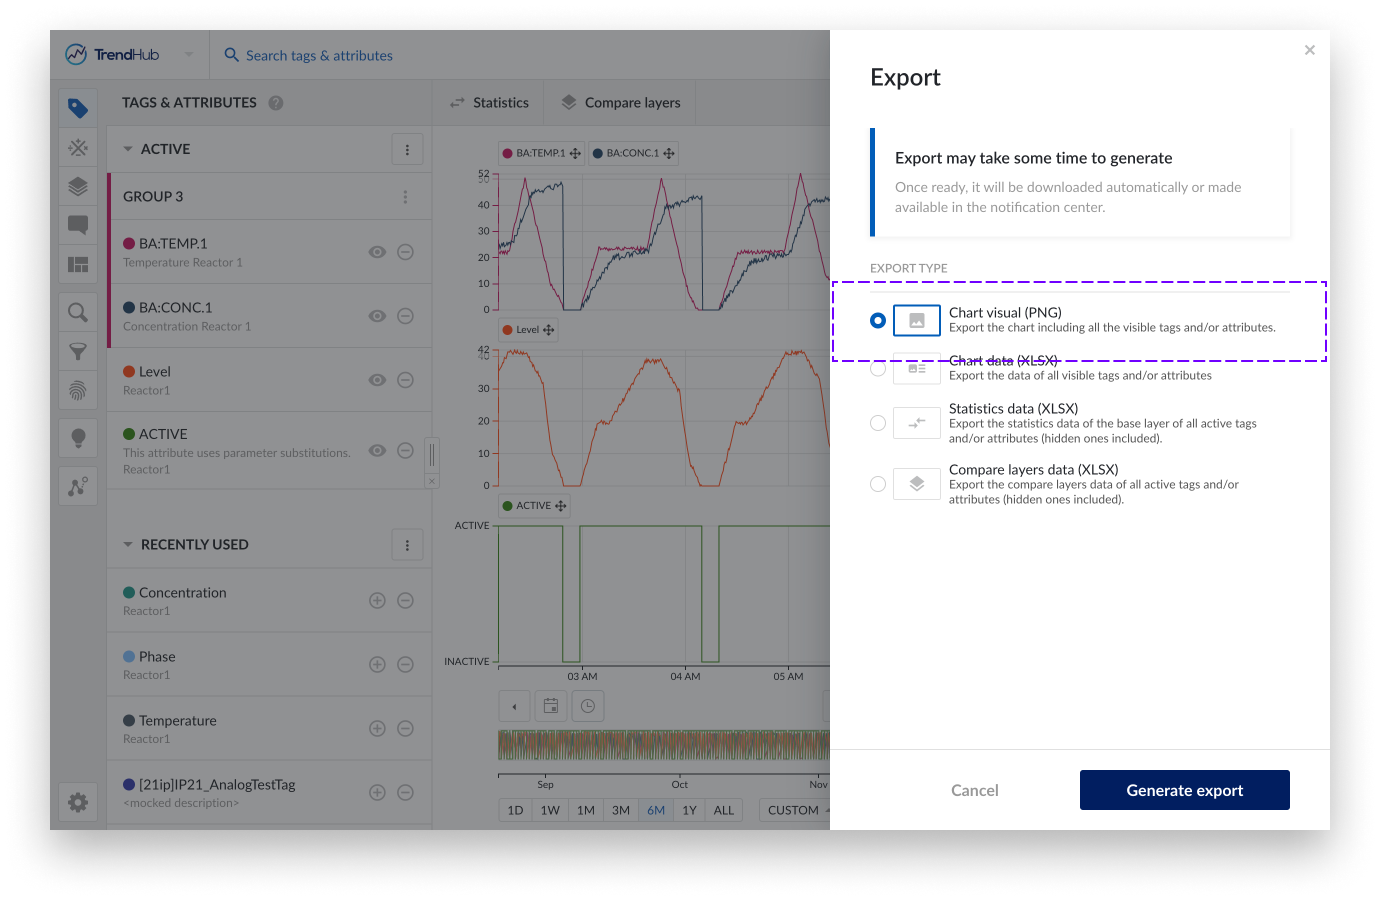
En cliquant sur le bouton d'exportation, un panneau latéral apparaît dans lequel vous pouvez choisir l'une des possibilités suivantes :
Image du graphique : Exportez le graphique de focus incluant tous les tags et/ou attributs visibles.
Données du graphique : Exportez les données d'index interpolées du graphique de focus pour tous les tags et ou attributs visibles.
Données statistiques : Exportez les données statistiques du calque de base pour tous les tags et ou attributs actifs (y compris ceux qui sont cachés).
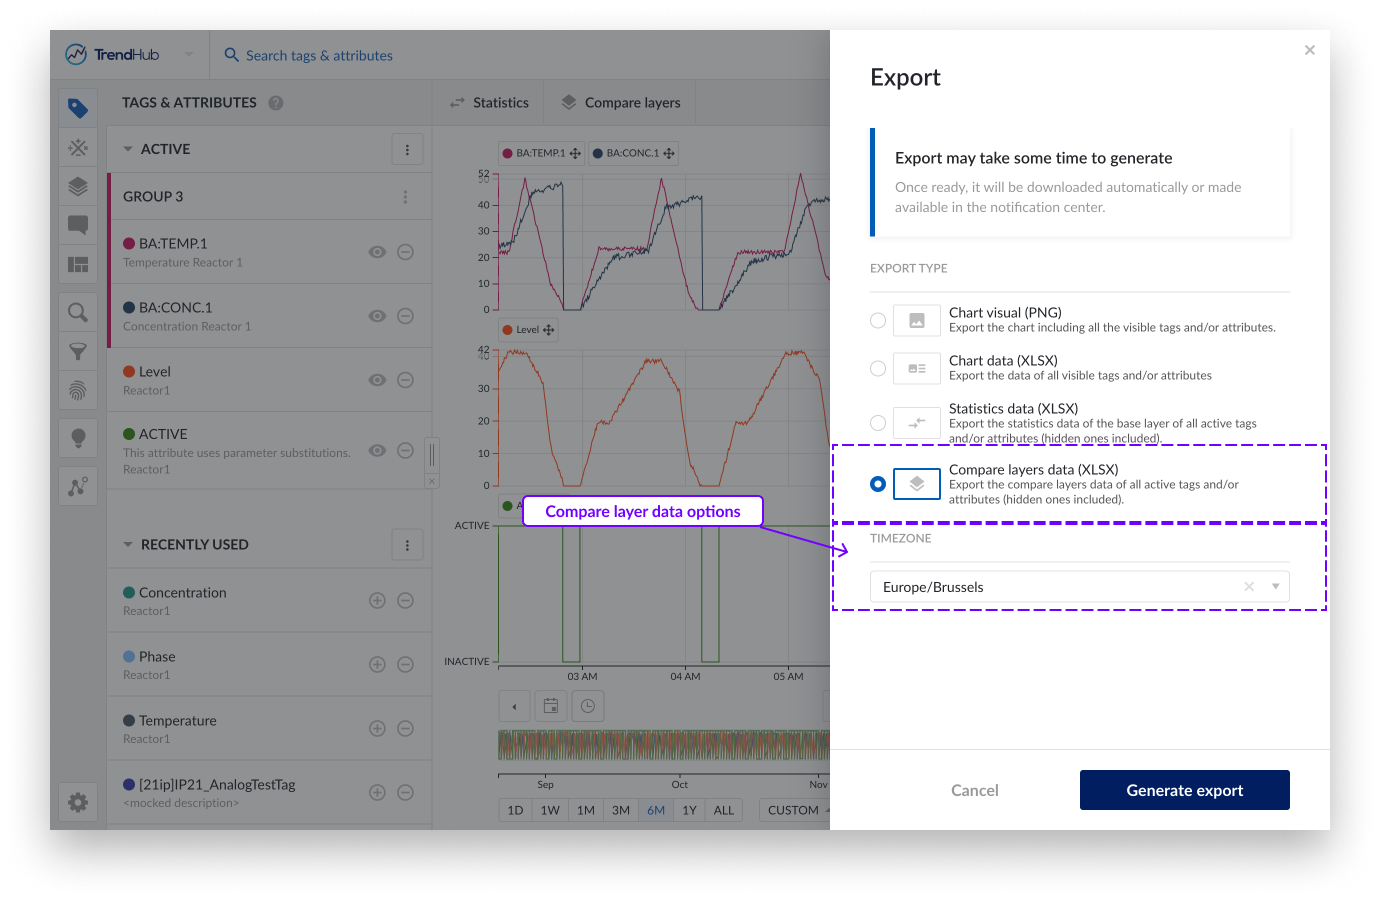
Données de comparaison des calques : Exportez les données de comparaison des calques de tous les tags et/ou attributs actifs (y compris ceux qui sont cachés).
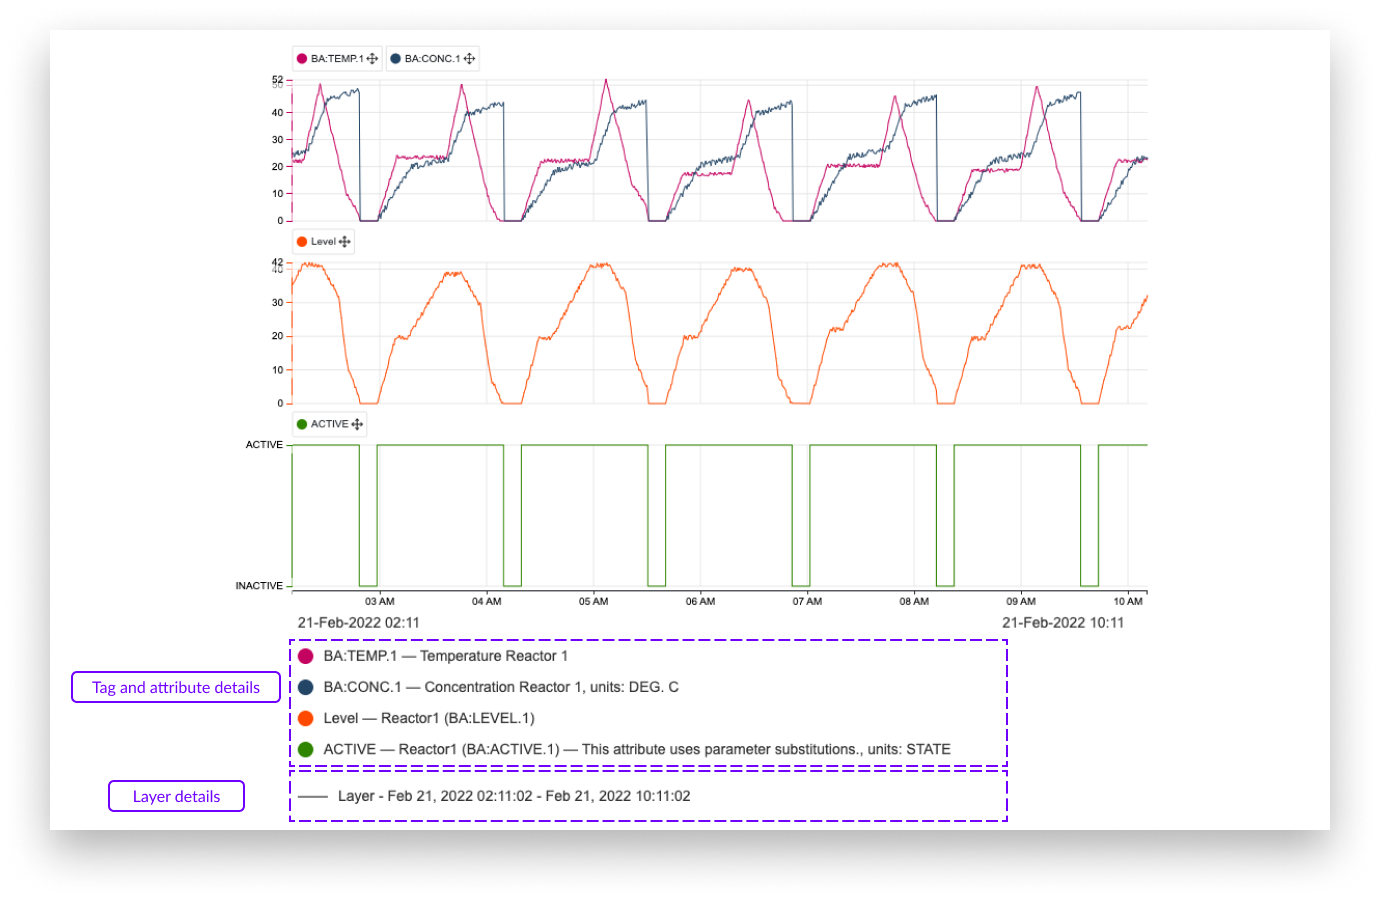
The focus chart image export contains any visible detail of the focus chart, going from any visualization mode to even a context item or a data scooter. Settings are also included in the visual chart export.
The screenshot below shows an example of a visual chart export. Details of the tags and attributes are shown below the chart itself. They include:
Color of tags or attributes
Name of the tag or attribute
The parent's name of an attribute (not applicable for tags)
Description of tag or attribute (if available)
The shift of the tag or attribute (if applied)
Units of measurement (if available)
Also included in the export is information about the layers.
Line style of the layers
Name of the layer (default value 'Layer')
Start and end date and time of the layers
Note
Chart visual export will download automatically once ready.
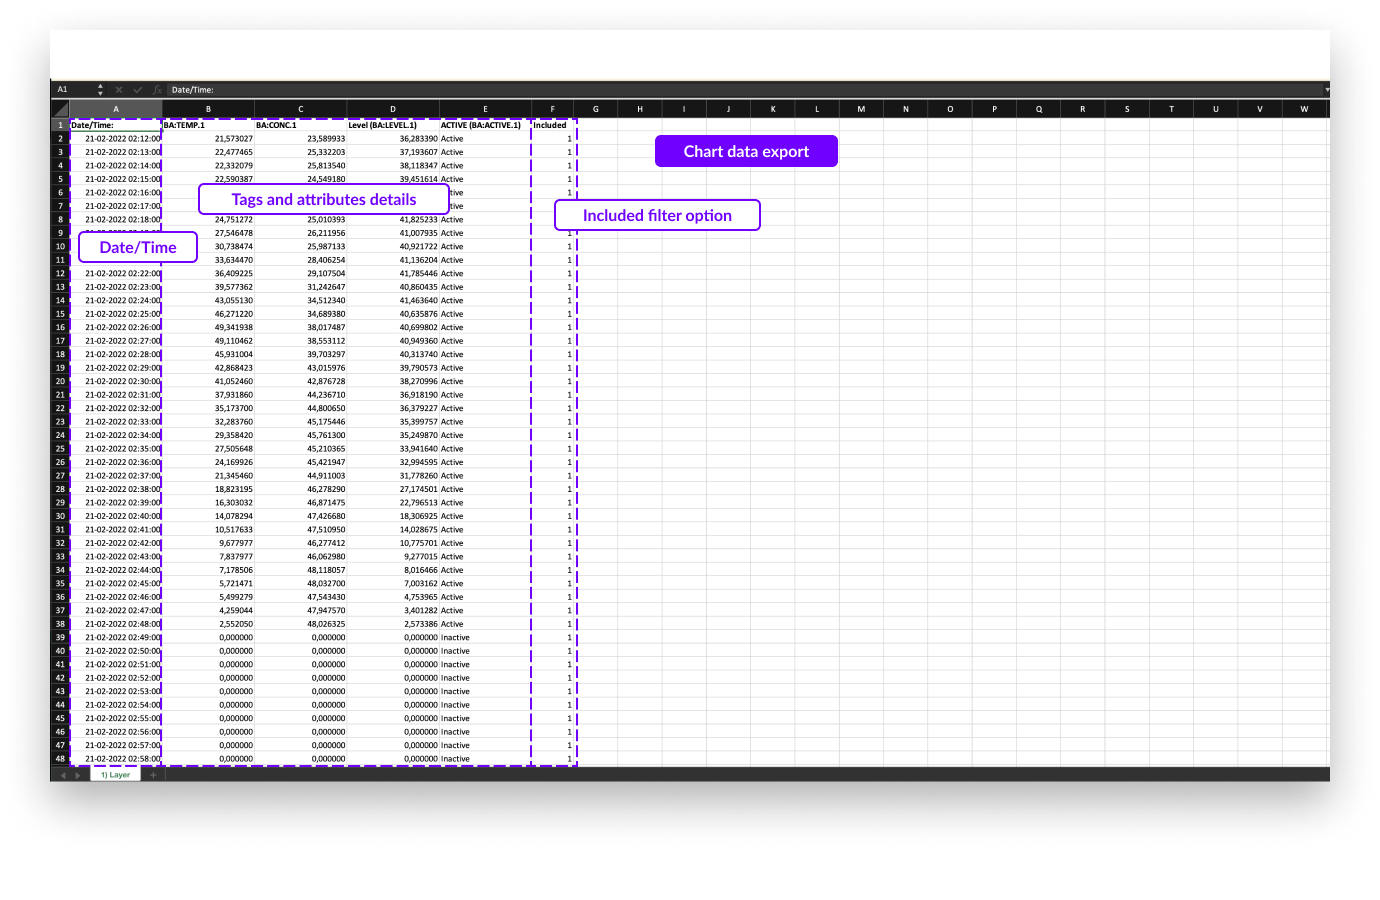
The focus chart data export contains the interpolated indexed data of the visible tags and attributes for the current period of the focus chart and all the active layers (one layer per Excel sheet).
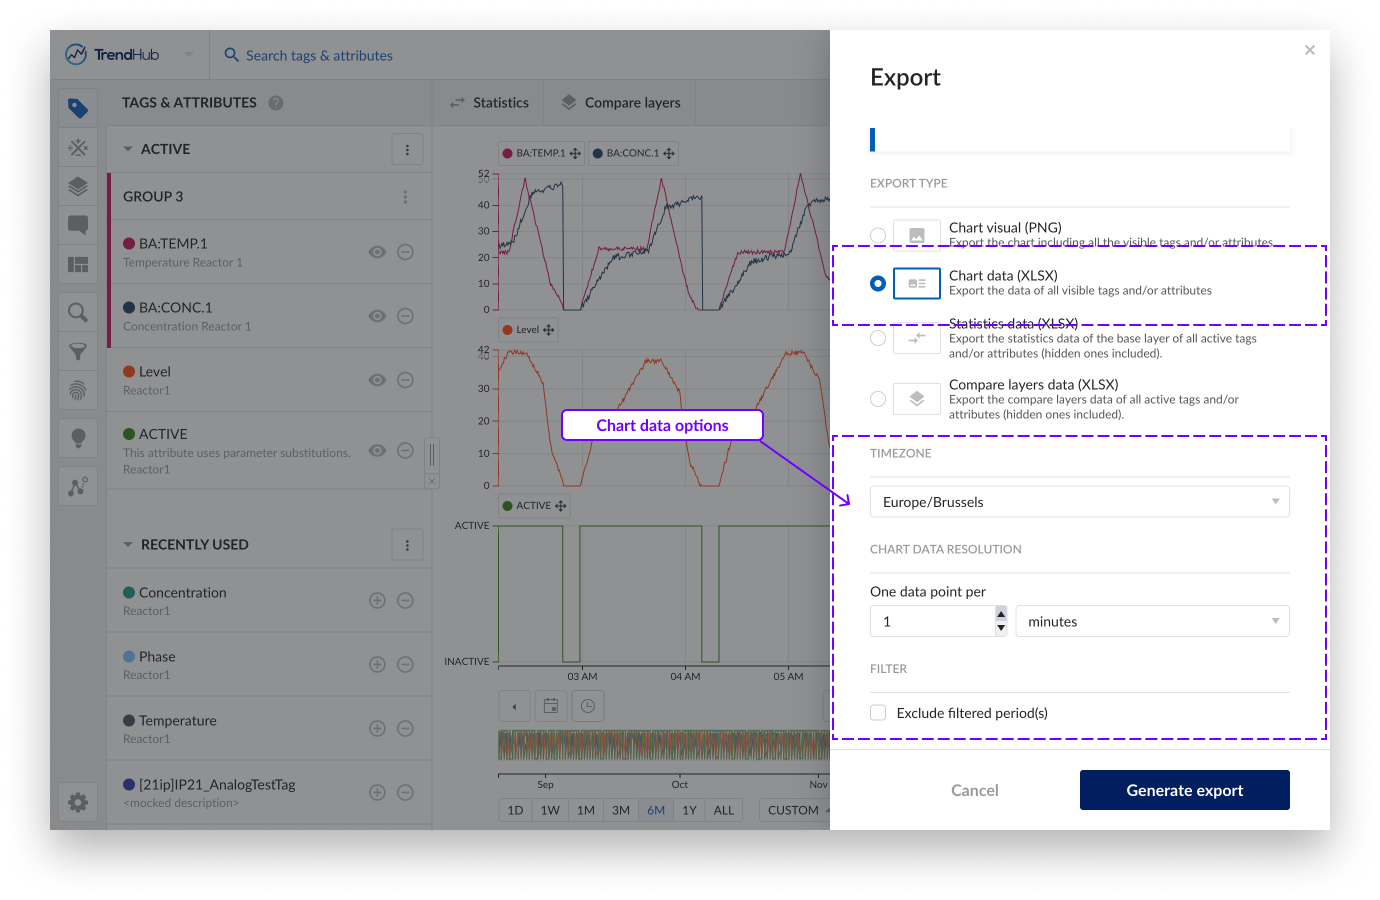
The chart data export has some extra settings that can be adjusted / applied before exporting your data.
Timezone, this setting lets you choose the desired time zone. This setting is also saved for your user which means that in the next session, it is automatically set to the last used timezone. This is useful when sharing exported files with colleagues in different areas. This setting is also saved for your user which means that in the next session, it is automatically set to the last used timezone.
Chart data resolution, this setting lets you adjust the resolution of points to be included in the Excel file. The overall minimum resolution is set to the indexing resolution which depends on your setup (1 minute by default). The exported Excel file itself is limited to include maximum 1 million points. Therefore, the allowed minimum resolution will scale based on the visualized window, the number of visualised tags, the number of visible layers.
Filter, when having periods filtered out, you can exclude these periods in the export file. Learn more about filters in this document.
Note
Revisit the chart data resolution option after checking the exclude filter option. Since less data points will be exported, the chart data resolution can potentially be increased.
In the image of the export file below, you can see one column shows the date and time followed by all visible tags and/or attributes. The last column "Included" in the file indicates if the period was filtered (0) or not (1).
Each sheet of the export file shows additional layers (if present).
Note
Chart data export can be downloaded in the notification center once created. The download stays available for 7 days before it 'expires'.
The statistics table data export exports all descriptive statistics of the base layer. This export only has one setting that can be adjusted.
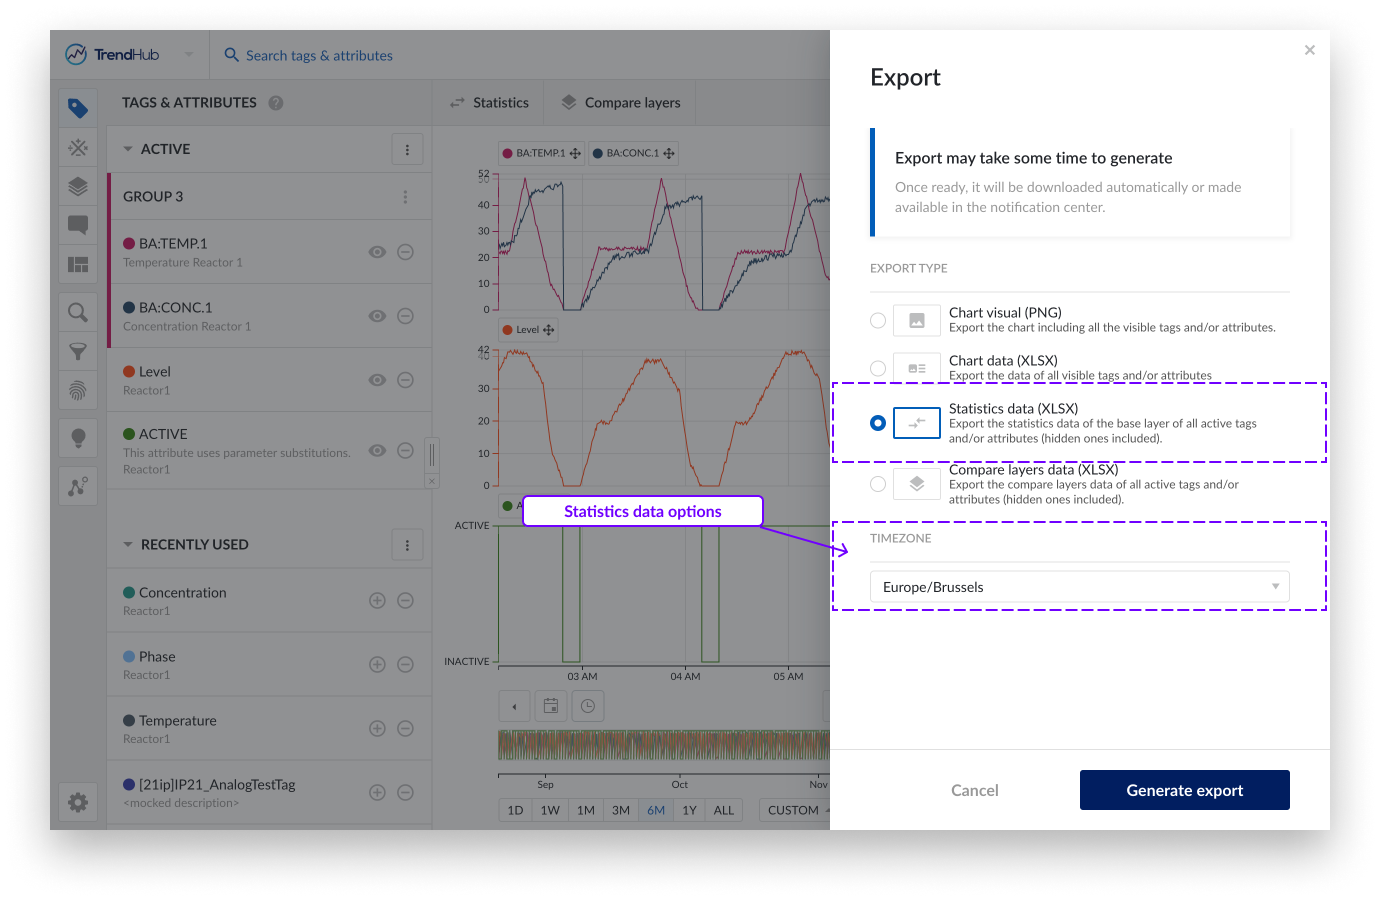
Timezone, this setting lets you choose the desired time zone. This setting is also saved for your user which means that in the next session, it is automatically set to the last used time zone.
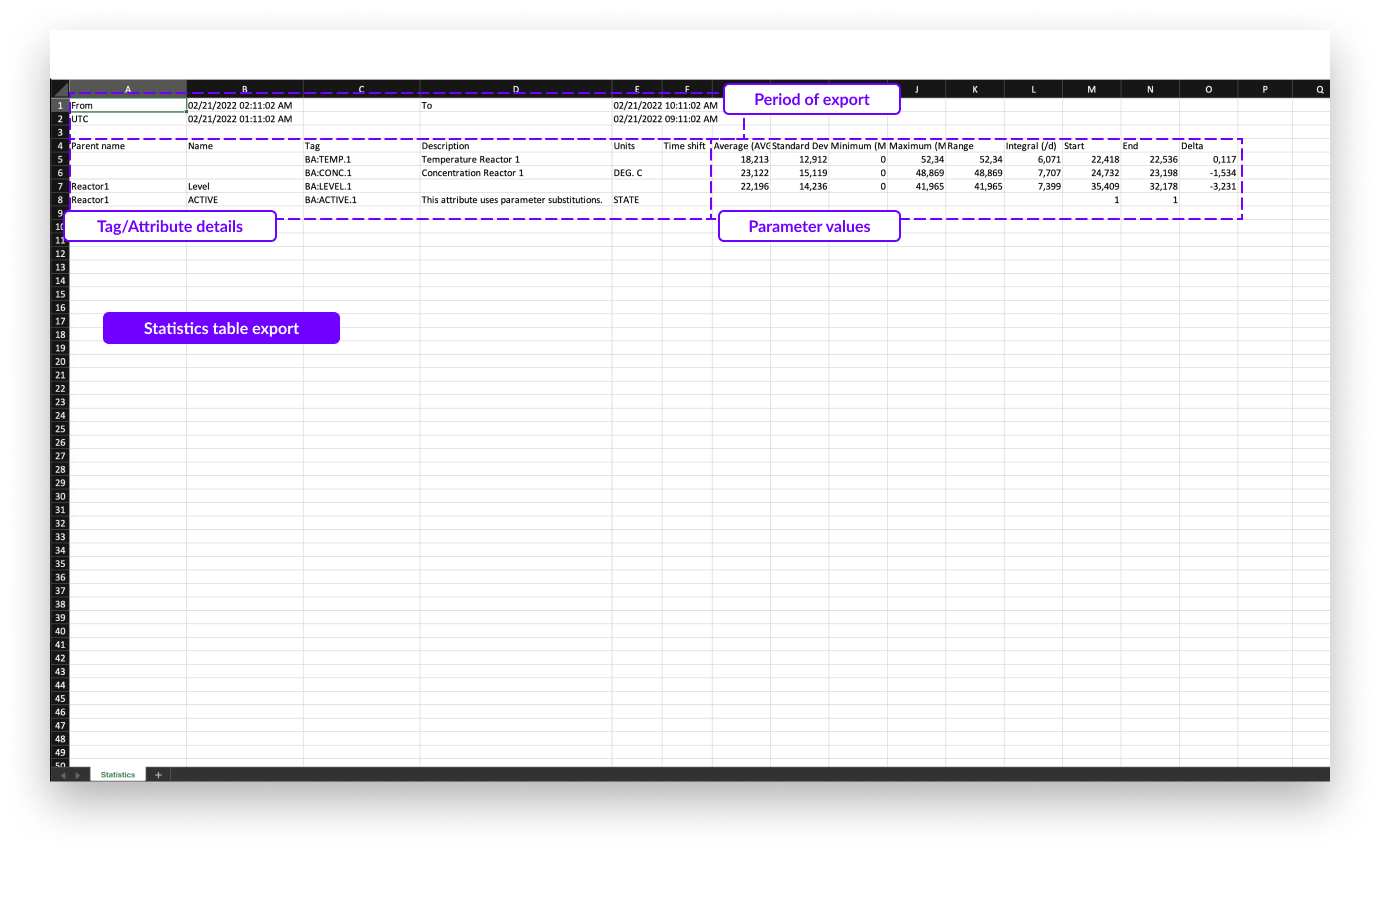
In the export file below, the following information is shown:
Start and end date and time of the focus chart in the selected time format.
Start and end date and time of the focus chart in UTC format.
All information about the tags and attributes is shown, including:
Parent name (only applicable for attributes)
Attribute name (only applicable for attributes)
Tag name
Description (if available)
Units of measurement (if available)
The time shift of the tag or attribute (if applied)
All descriptive statistics.
Note
Statistics table export will download automatically once ready.
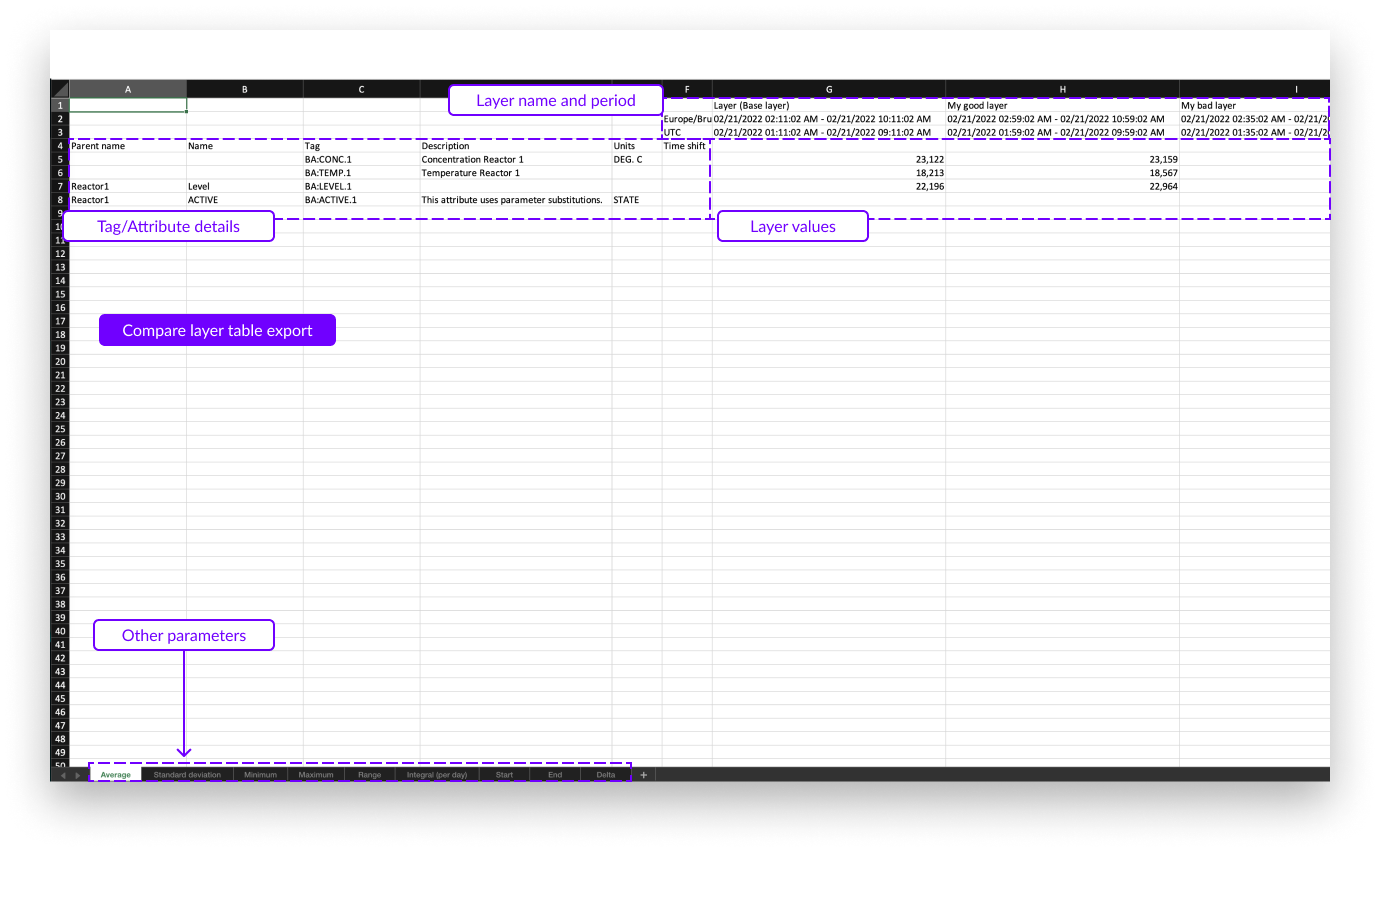
The compare layer table data export looks similar to the statistics table export. Again, all key parameters are present in the export but now one per sheet in the Excel file. In this export only the timezone setting can be adjusted.
Timezone, this setting lets you choose the desired time zone. This setting is also saved for your user which means that in the next session, it is automatically set to the last used time zone.
In the export file below, the following information is shown:
The tag and/or attribute details on the left, including:
Parent name (only applicable for attributes)
Attribute name (only applicable for attributes)
Tag name
Description (if available)
Units of measurement (if available)
The time shift of the tag or attribute (if applied)
Layers details on the right which contain the following:
Layer name (and mentioning of base layer)
Start and end date and time of the layer in the selected time zone
Start and end date and time of the layer in UTC format
Value of the current statistics
Note
Compare layer table export will download automatically once ready.
Vous pouvez également exporter les résultats de recherche dans un fichier Excel. Veuillez consulter le document suivant pour en savoir plus sur l'exécution de recherches dans TrendHub.
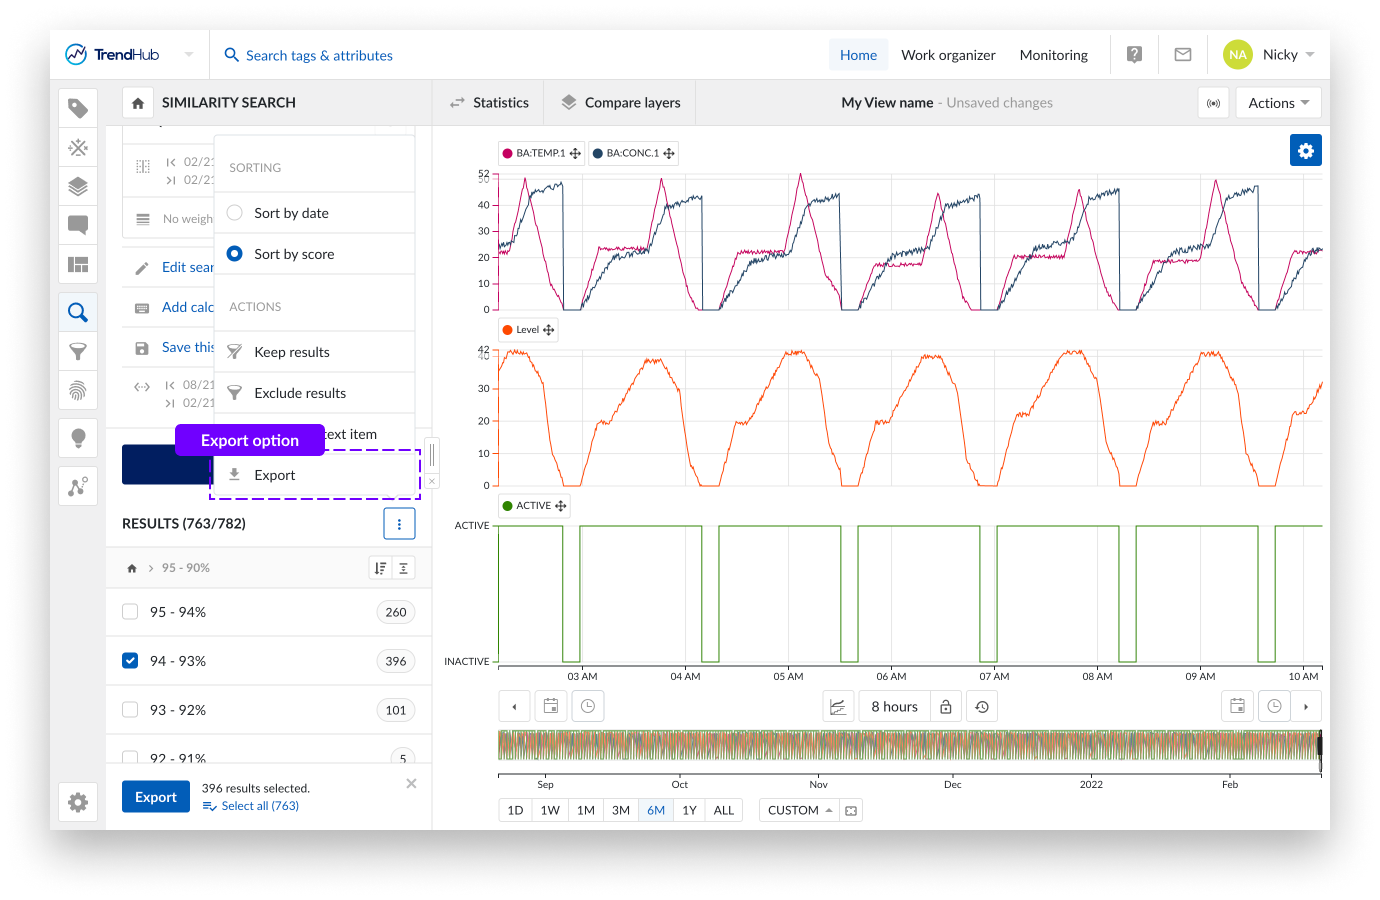
Dès qu'une recherche est exécutée, les résultats de la recherche, ainsi que tous les calculs, peuvent être exportés. Pour exporter les résultats de la recherche, il suffit de cliquer sur le bouton d'options à trois points dans l'en-tête des résultats, puis sur l'option "Exporter".
Vous pouvez alors sélectionner les résultats que vous souhaitez exporter et choisir le fuseau horaire souhaité avant que l'exportation ne soit lancée.
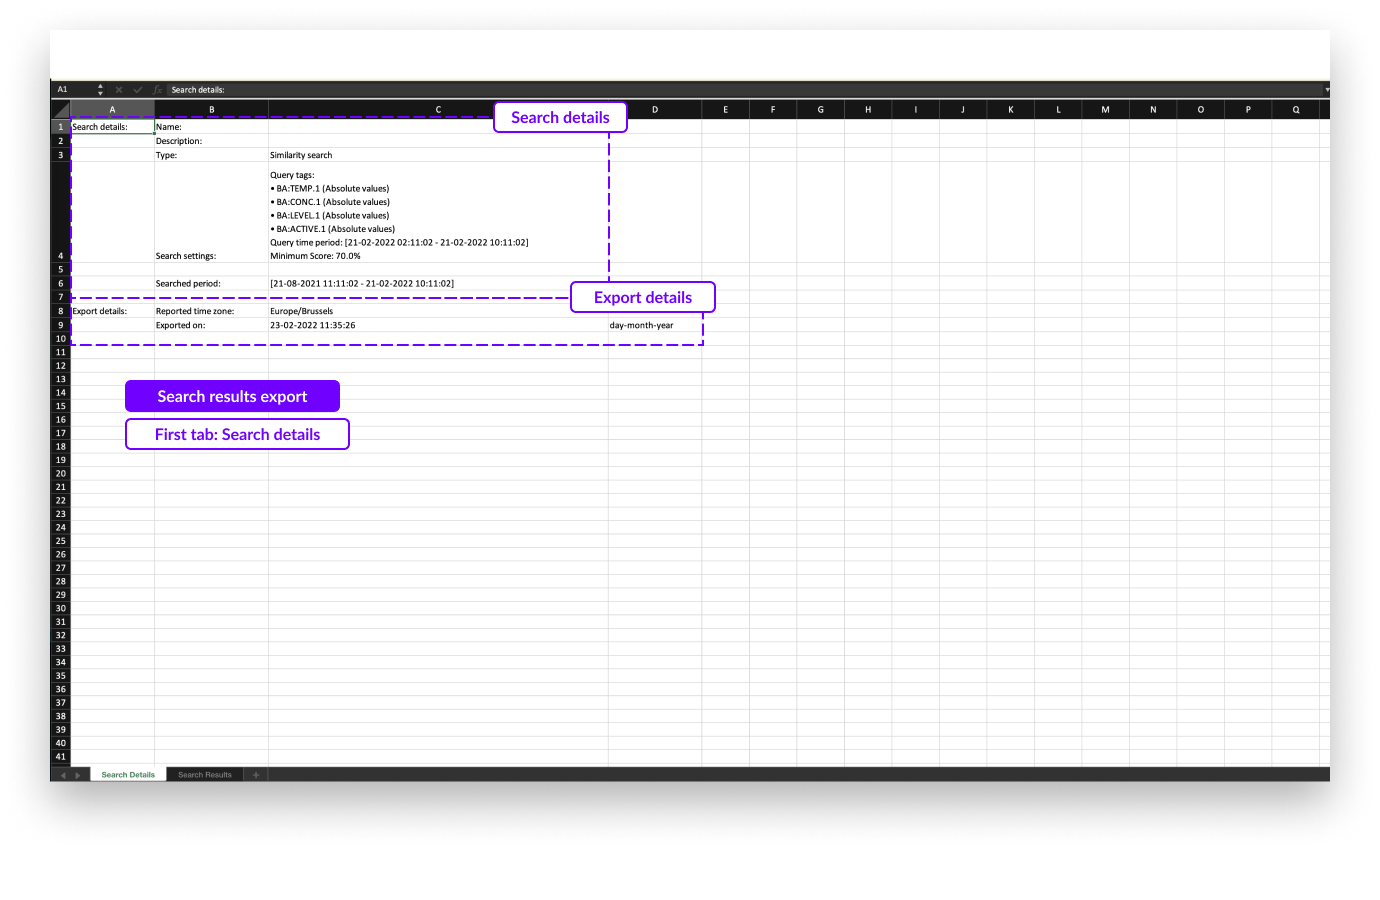
Le fichier Excel exporté se compose de 2 onglets :
Un premier onglet, sommaire, contenant les détails de la recherche
Un deuxième onglet contenant les détails des résultats de la recherche
Dans le premier onglet, vous verrez les détails suivants concernant la recherche :
Nom de la recherche (si disponible ; ceci s'applique uniquement aux recherches sauvegardées)
Description de la recherche (si disponible ; ceci s'applique uniquement aux recherches sauvegardées)
Type de recherche
Paramètres de la recherche incluant
Tags interrogés
Période interrogée (recherche de similarité)
Score minimum (recherche de similarité)
Poids et période des poids (recherche de similarité)
Période recherchée (Période de contexte)
Détails d'exportation comme le fuseau horaire et la date d'exportation
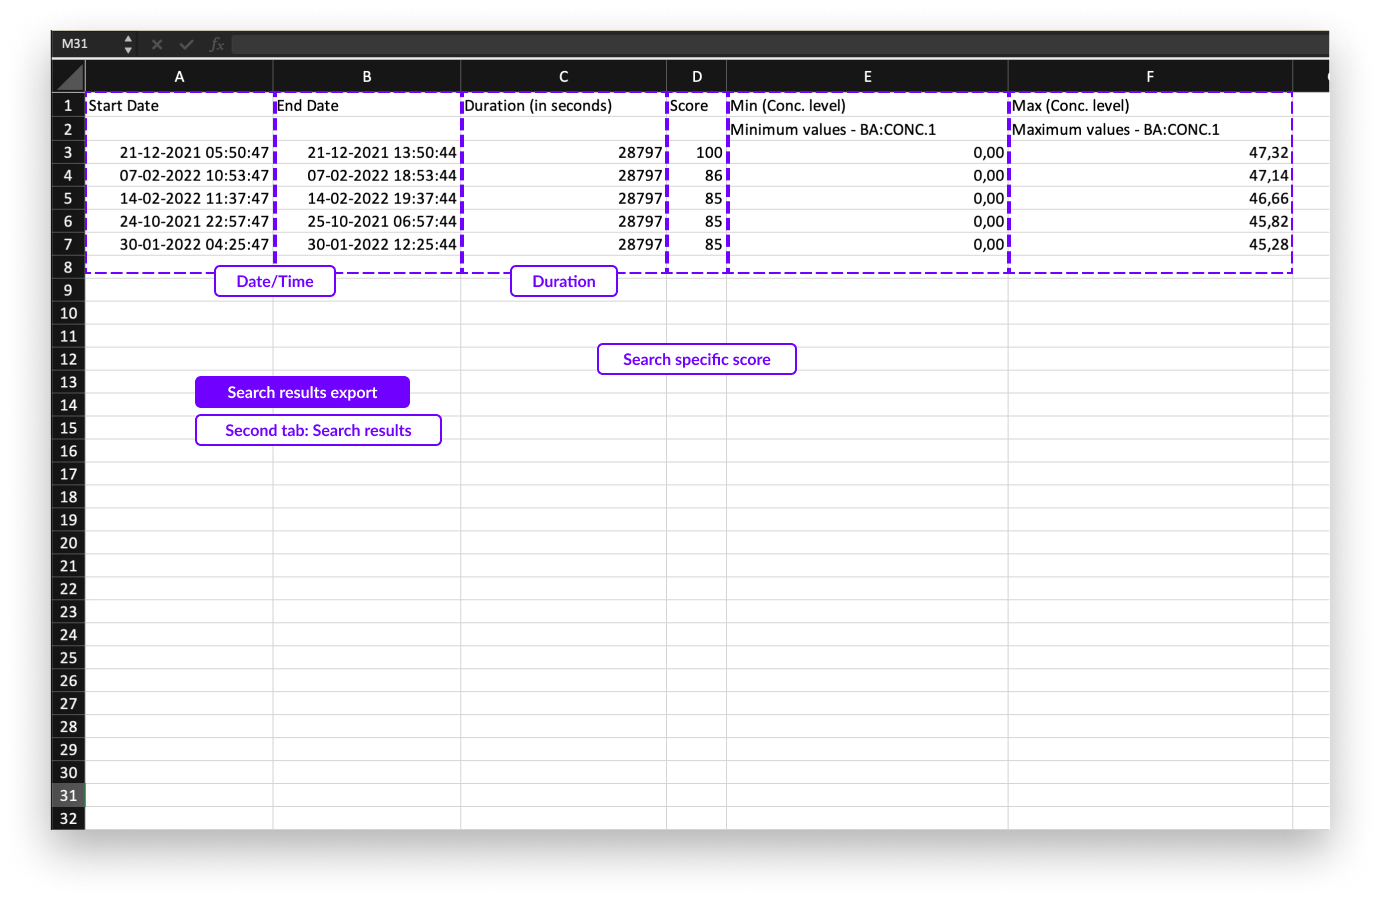
Dans le deuxième onglet du fichier d'exportation, vous trouverez les informations suivantes sur les résultats de la recherche :
Dates de début et de fin dans les deux premières colonnes.
La durée du résultat de la recherche.
Paramètre spécifique à la recherche (par exemple, score pour les résultats de recherche de similarité).
1 colonne supplémentaire par calcul.
Note
Une fois créée, l'exportation de résultats de recherche peut être téléchargée dans le centre de notification. Le téléchargement reste disponible pendant 7 jours avant d'expirer.