Exportación de datos e imágenes
Exportaciones
TrendHub dispone de diferentes opciones para exportar datos, que pueden agruparse en 2 categorías:
Todas las opciones de exportación relacionadas con las vistas de TrendHub se encuentran en la lista de acciones de su barra de vistas.
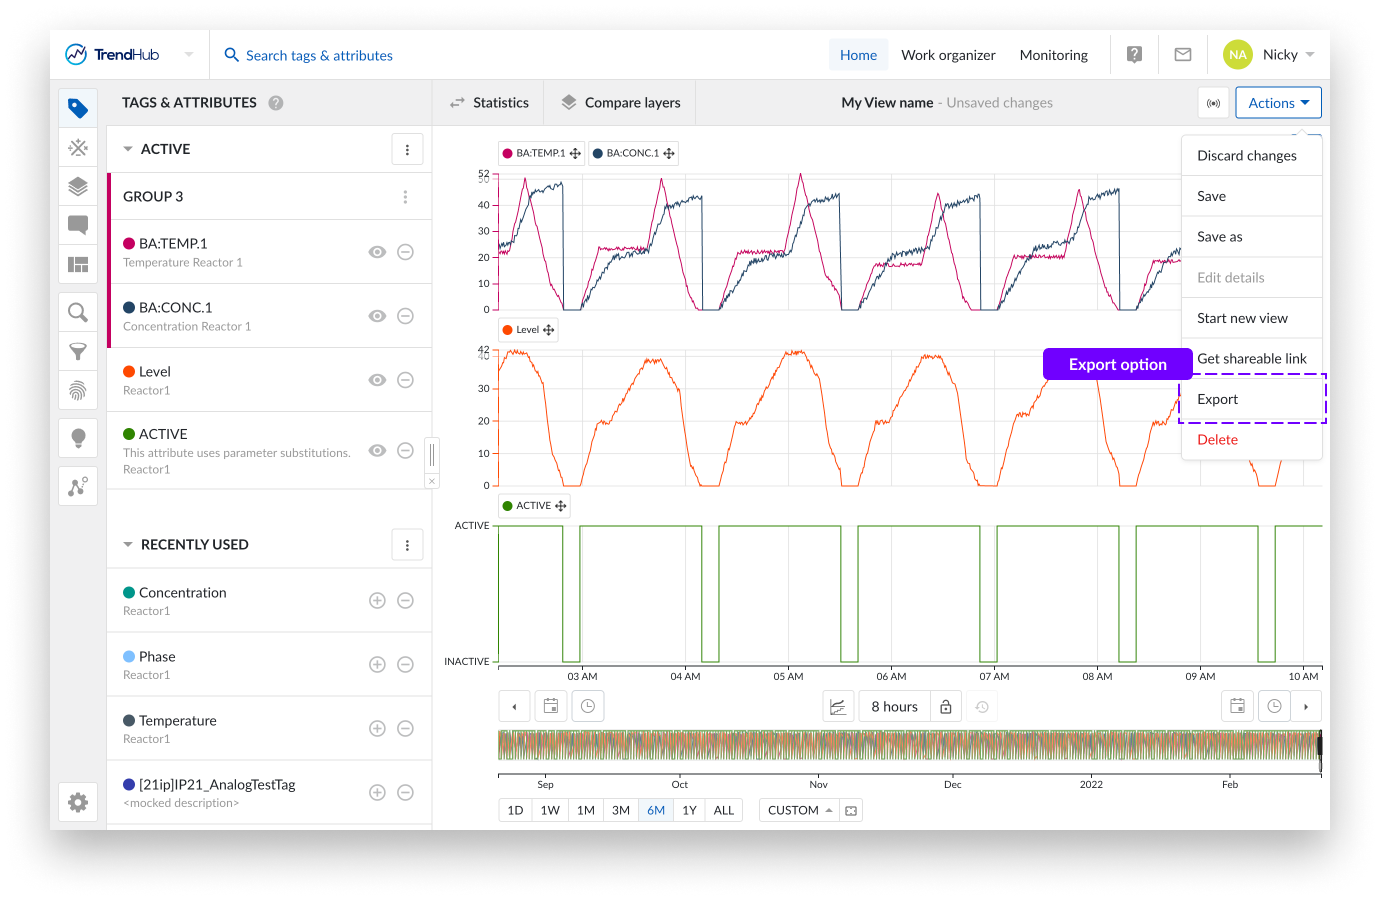
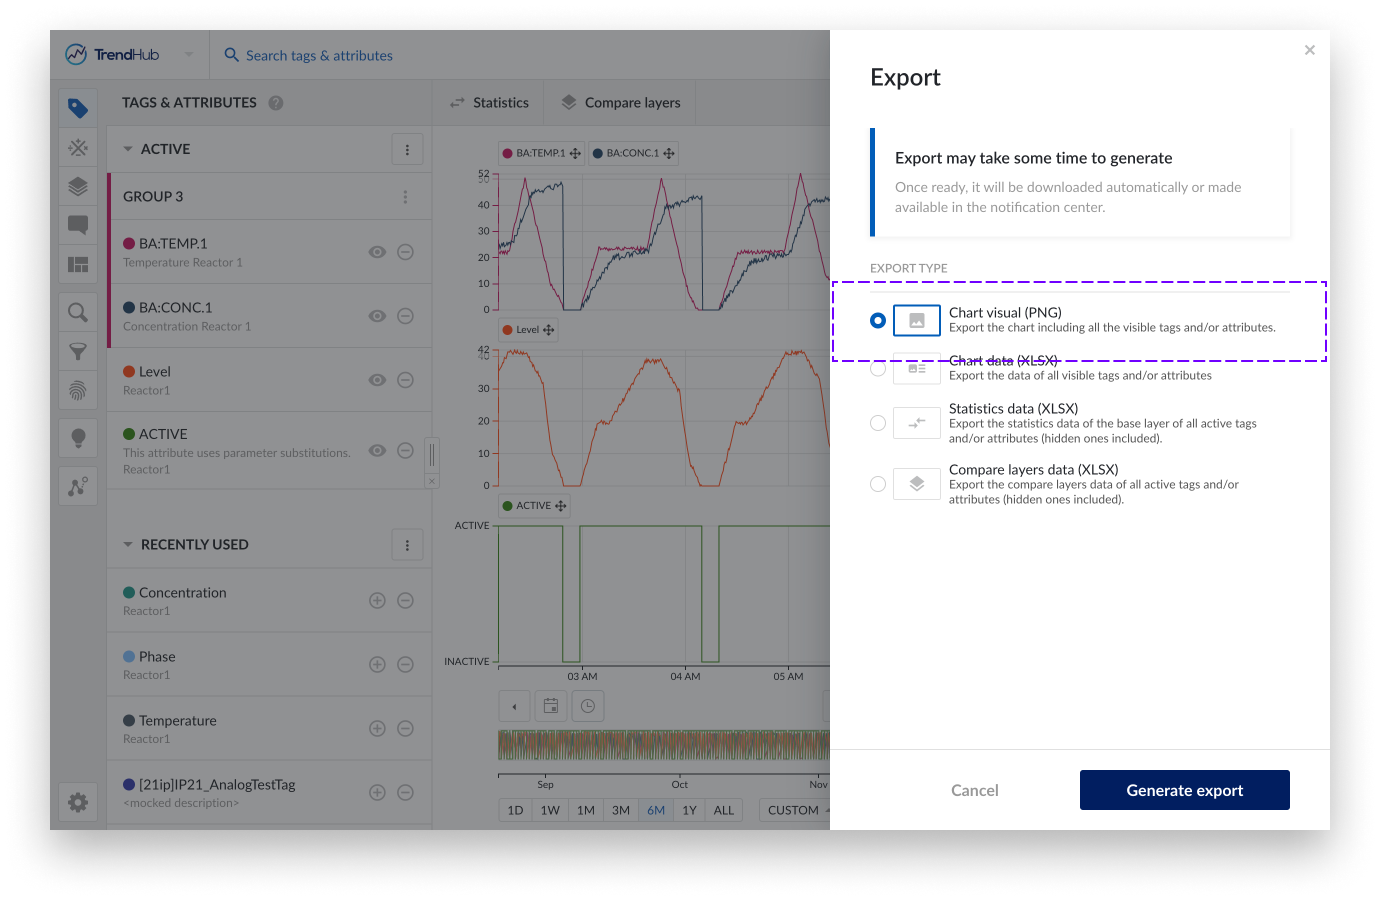
Al pulsar el botón de exportación aparece un panel lateral en el que puede elegir una de las siguientes posibilidades:
Visual del gráfico: Exporte el gráfico del gráfico de enfoque incluyendo todas las etiquetas y/o atributos visibles.
Datos del gráfico: Exporte datos de índice interpolados del gráfico de enfoque para todas las etiquetas y/o atributos visibles.
Datos estadísticos: Exporte los datos estadísticos de la capa base para todas las etiquetas y/o atributos activos (incluidos los ocultos).
Comparar datos de capas: Exporte los datos de las capas de comparación de todas las etiquetas y/o atributos activos (incluidos los ocultos).
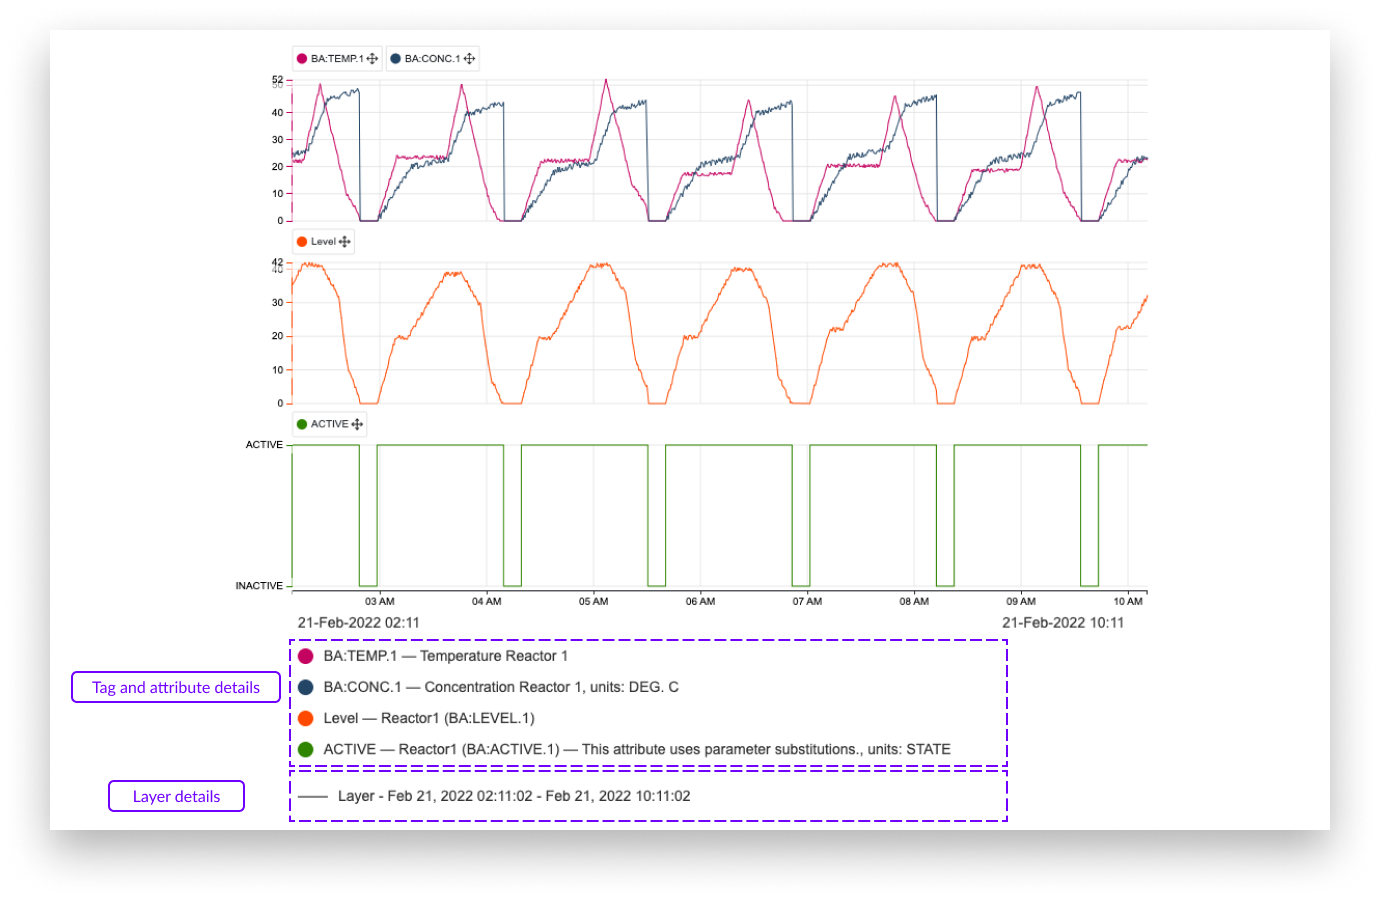
The focus chart image export contains any visible detail of the focus chart, going from any visualization mode to even a context item or a data scooter. Settings are also included in the visual chart export.
The screenshot below shows an example of a visual chart export. Details of the tags and attributes are shown below the chart itself. They include:
Color of tags or attributes
Name of the tag or attribute
The parent's name of an attribute (not applicable for tags)
Description of tag or attribute (if available)
The shift of the tag or attribute (if applied)
Units of measurement (if available)
Also included in the export is information about the layers.
Line style of the layers
Name of the layer (default value 'Layer')
Start and end date and time of the layers
Nota
Chart visual export will download automatically once ready.
The focus chart data export contains the interpolated indexed data of the visible tags and attributes for the current period of the focus chart and all the active layers (one layer per Excel sheet).
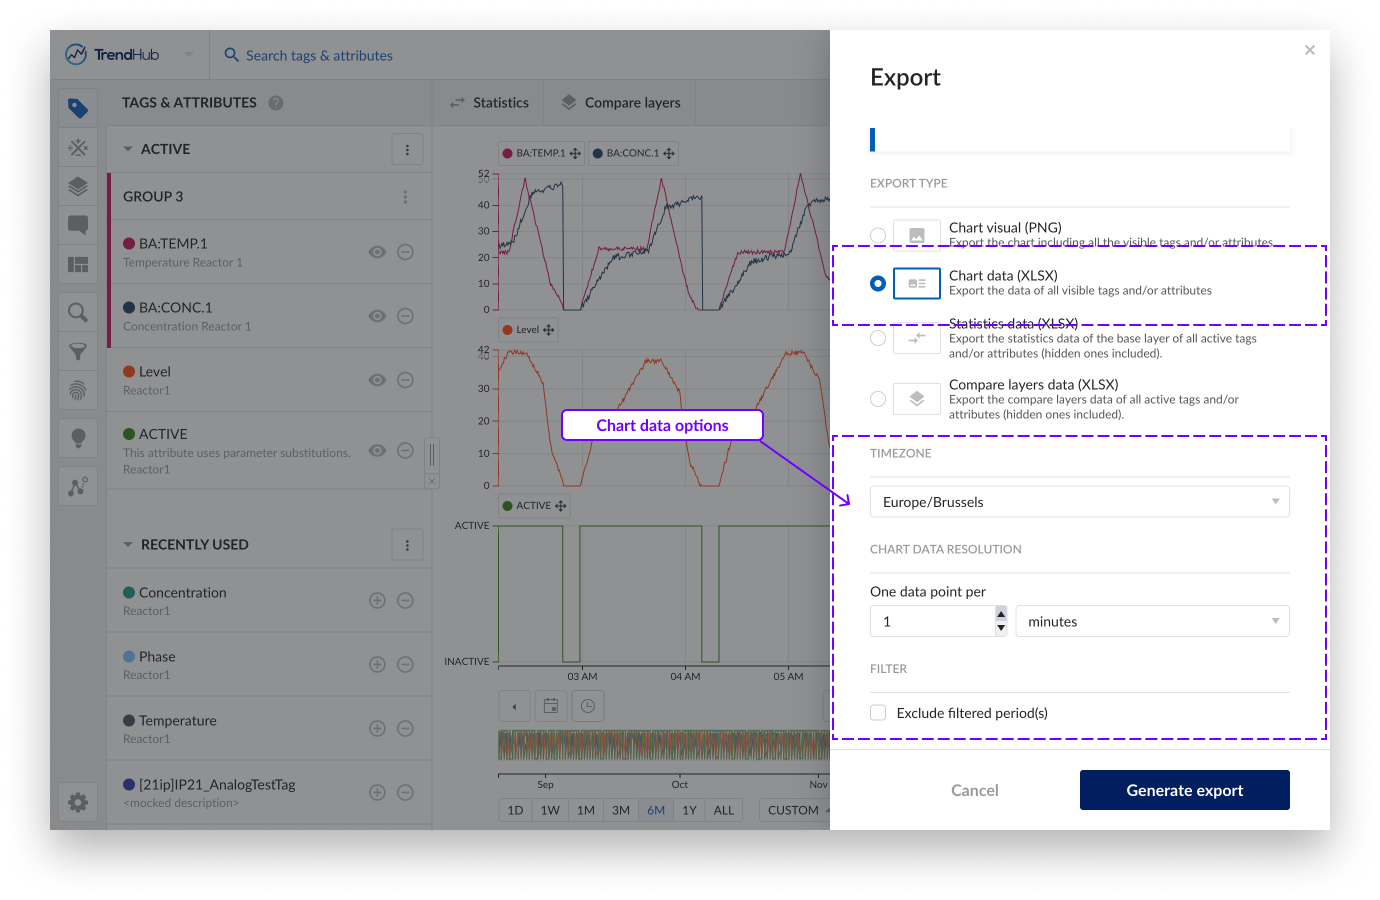
The chart data export has some extra settings that can be adjusted / applied before exporting your data.
Timezone, this setting lets you choose the desired time zone. This setting is also saved for your user which means that in the next session, it is automatically set to the last used timezone. This is useful when sharing exported files with colleagues in different areas. This setting is also saved for your user which means that in the next session, it is automatically set to the last used timezone.
Chart data resolution, this setting lets you adjust the resolution of points to be included in the Excel file. The overall minimum resolution is set to the indexing resolution which depends on your setup (1 minute by default). The exported Excel file itself is limited to include maximum 1 million points. Therefore, the allowed minimum resolution will scale based on the visualized window, the number of visualised tags, the number of visible layers.
Filter, when having periods filtered out, you can exclude these periods in the export file. Learn more about filters in this document.
Nota
Revisit the chart data resolution option after checking the exclude filter option. Since less data points will be exported, the chart data resolution can potentially be increased.
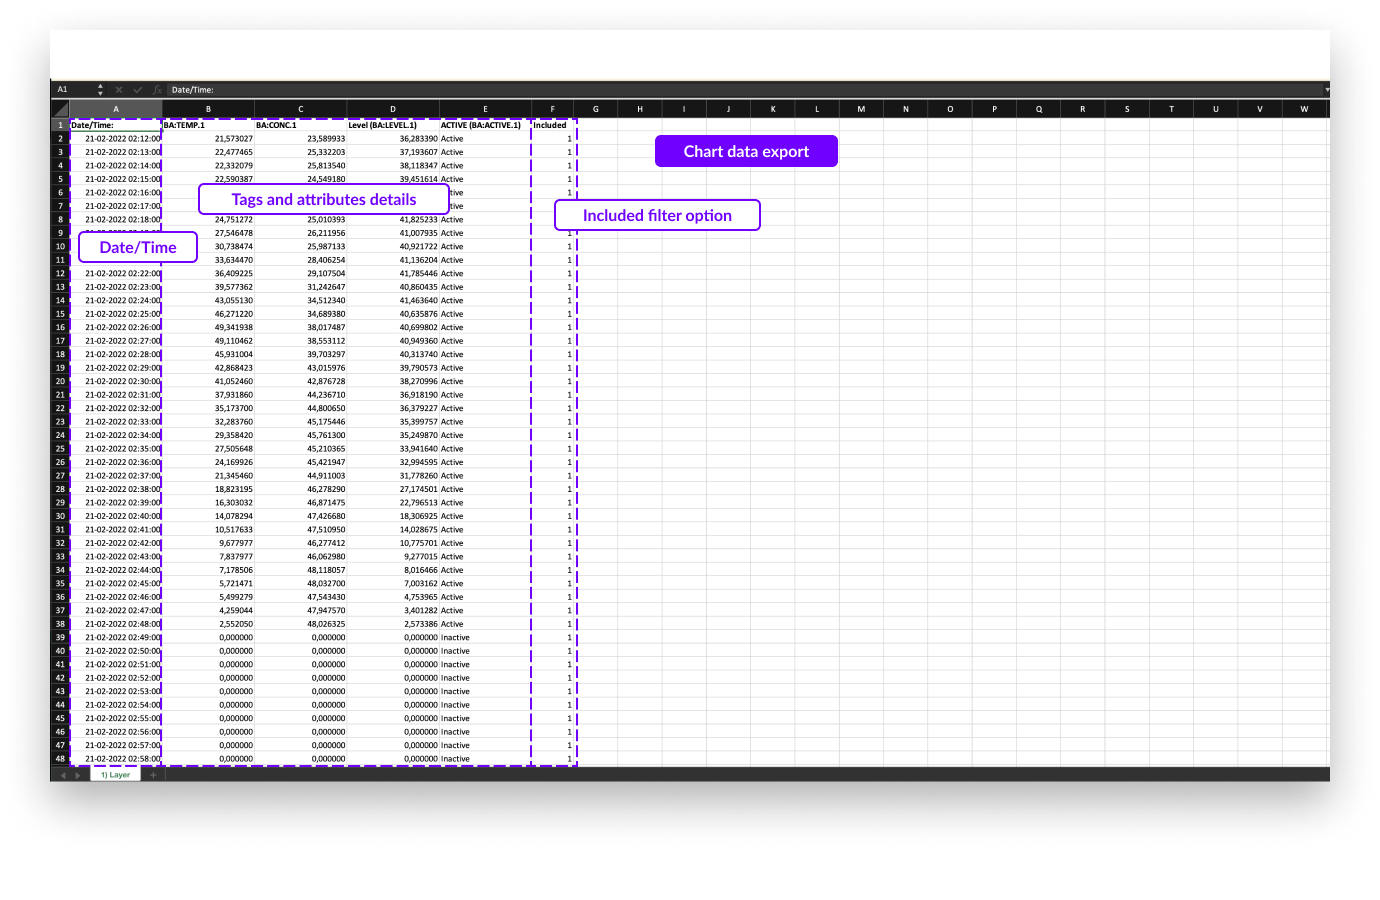
In the image of the export file below, you can see one column shows the date and time followed by all visible tags and/or attributes. The last column "Included" in the file indicates if the period was filtered (0) or not (1).
Each sheet of the export file shows additional layers (if present).
Nota
Chart data export can be downloaded in the notification center once created. The download stays available for 7 days before it 'expires'.
The statistics table data export exports all descriptive statistics of the base layer. This export only has one setting that can be adjusted.
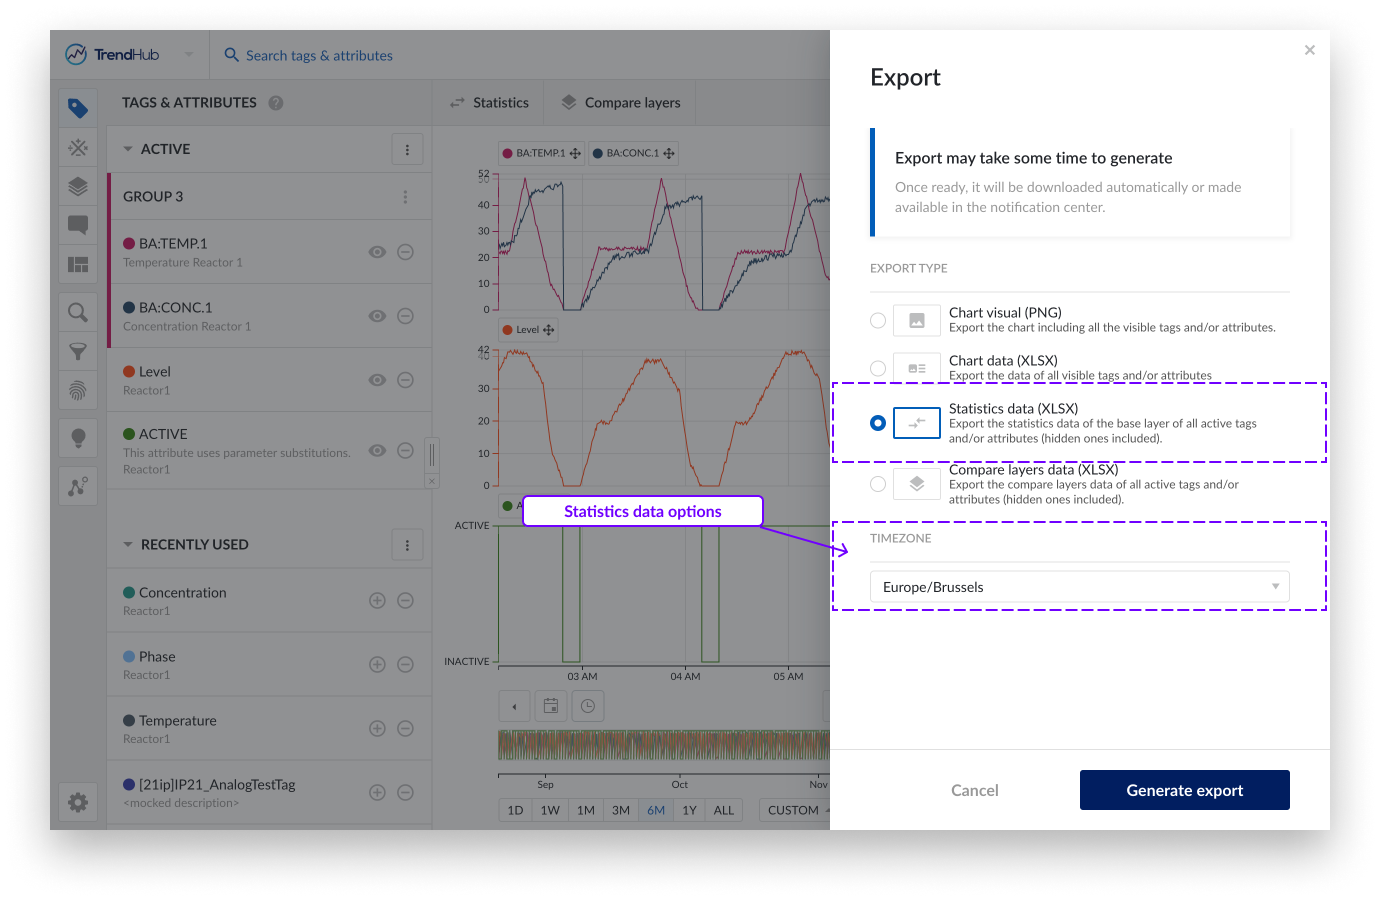
Timezone, this setting lets you choose the desired time zone. This setting is also saved for your user which means that in the next session, it is automatically set to the last used time zone.
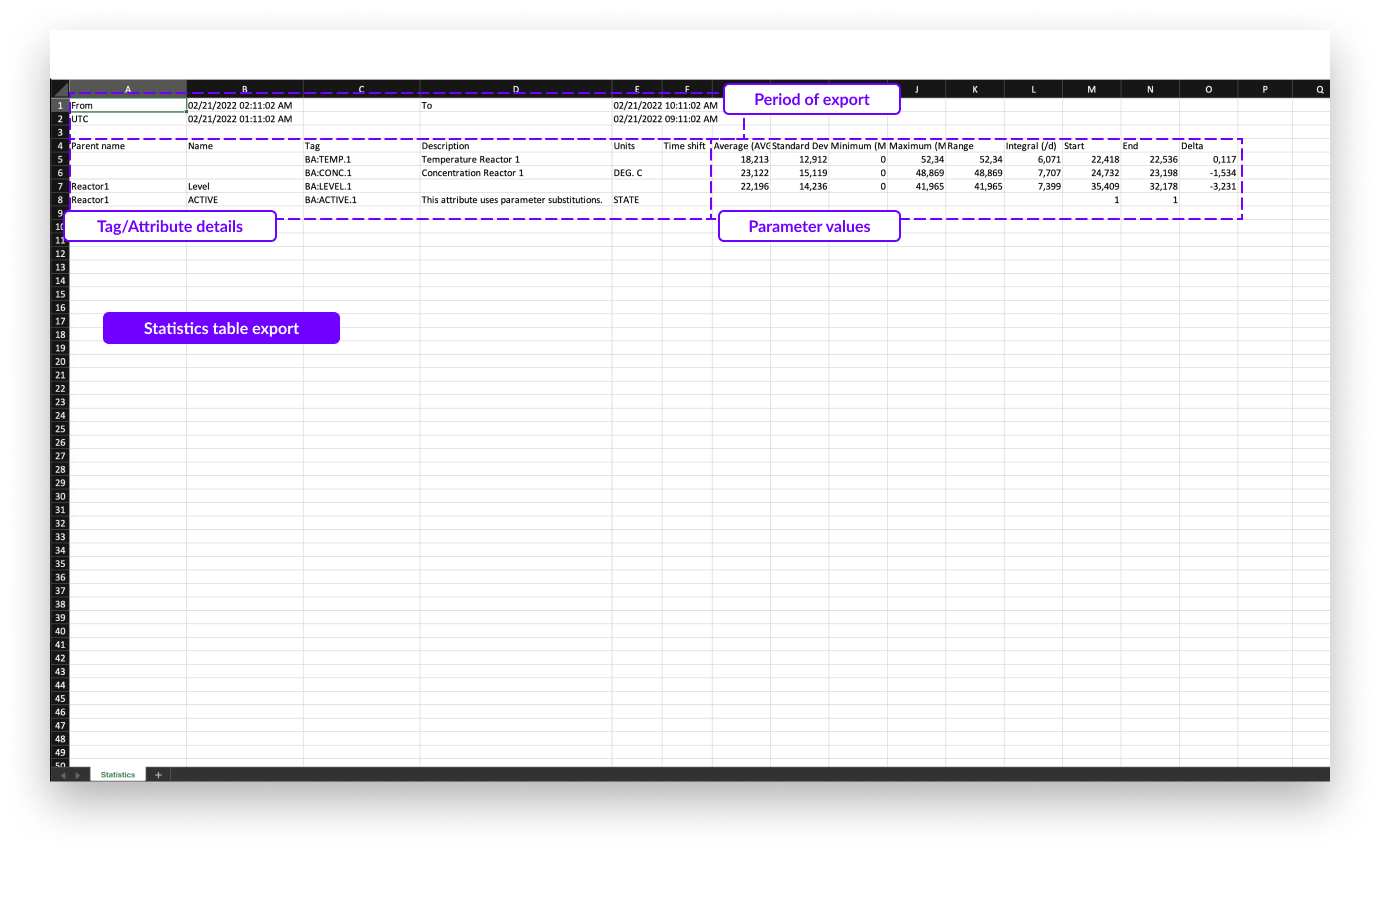
In the export file below, the following information is shown:
Start and end date and time of the focus chart in the selected time format.
Start and end date and time of the focus chart in UTC format.
All information about the tags and attributes is shown, including:
Parent name (only applicable for attributes)
Attribute name (only applicable for attributes)
Tag name
Description (if available)
Units of measurement (if available)
The time shift of the tag or attribute (if applied)
All descriptive statistics.
Nota
Statistics table export will download automatically once ready.
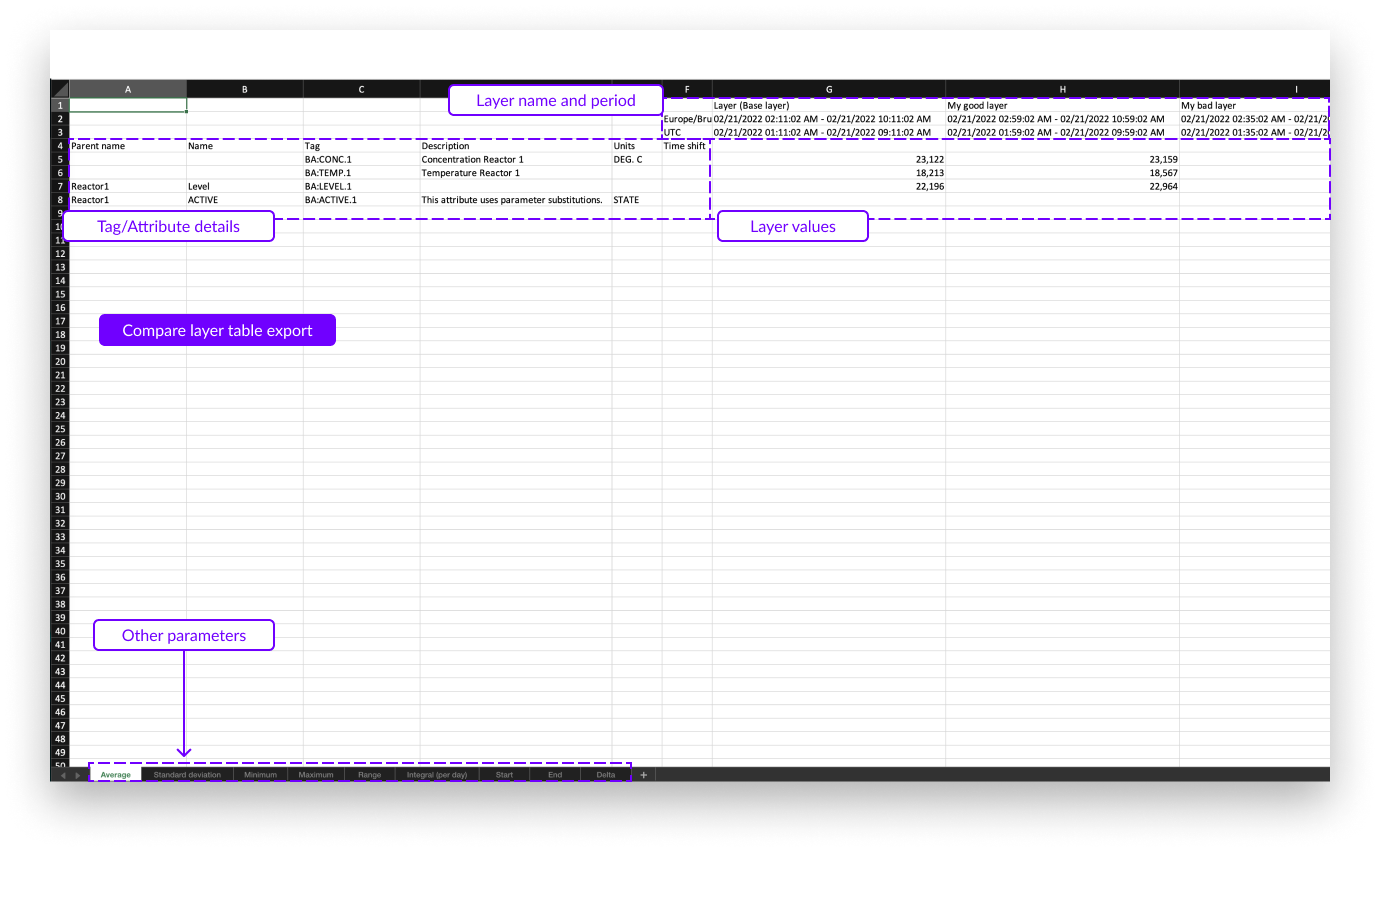
The compare layer table data export looks similar to the statistics table export. Again, all key parameters are present in the export but now one per sheet in the Excel file. In this export only the timezone setting can be adjusted.
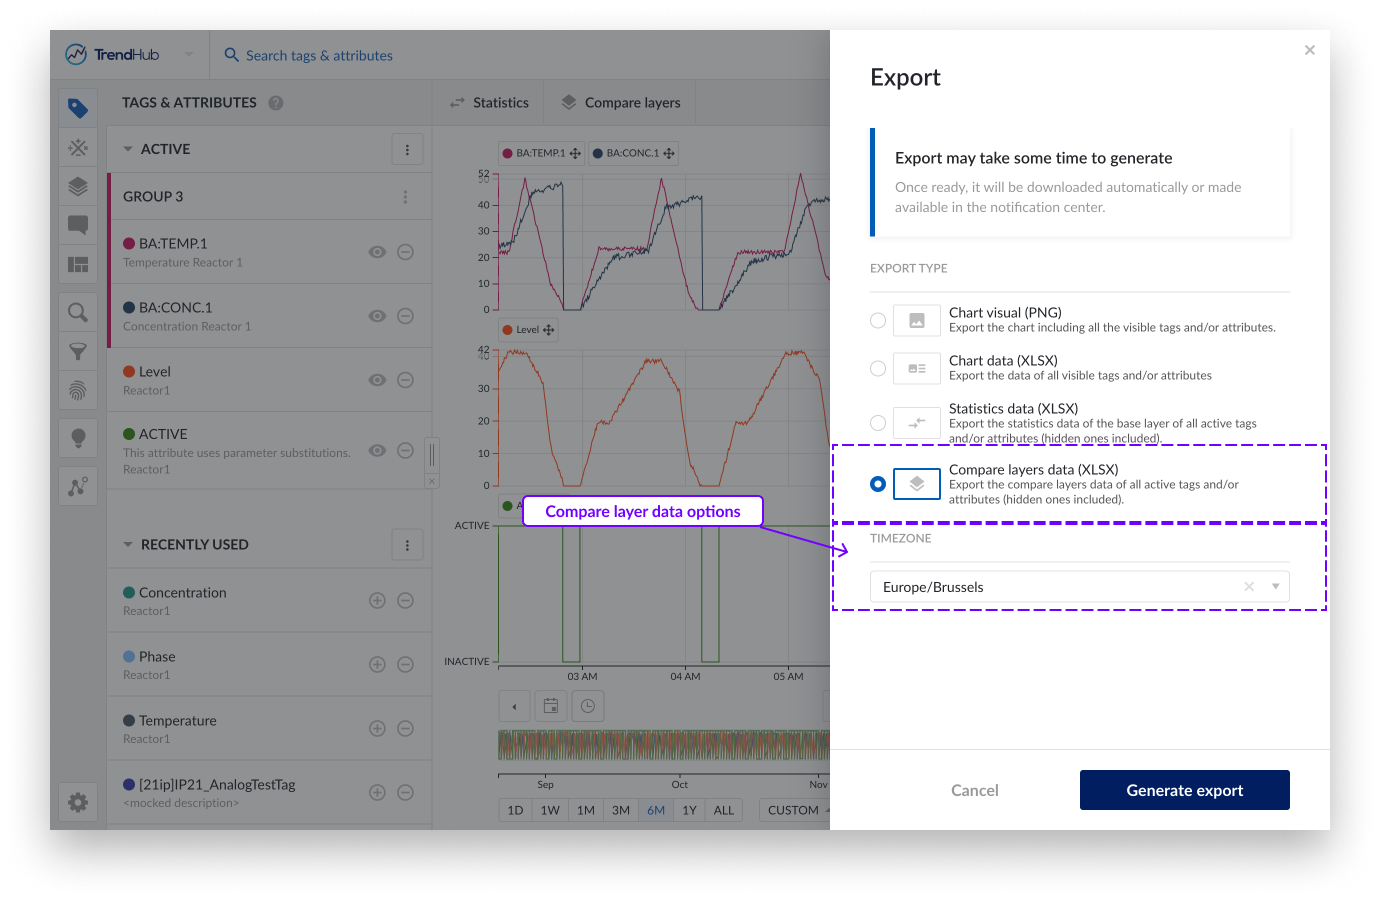
Timezone, this setting lets you choose the desired time zone. This setting is also saved for your user which means that in the next session, it is automatically set to the last used time zone.
In the export file below, the following information is shown:
The tag and/or attribute details on the left, including:
Parent name (only applicable for attributes)
Attribute name (only applicable for attributes)
Tag name
Description (if available)
Units of measurement (if available)
The time shift of the tag or attribute (if applied)
Layers details on the right which contain the following:
Layer name (and mentioning of base layer)
Start and end date and time of the layer in the selected time zone
Start and end date and time of the layer in UTC format
Value of the current statistics
Nota
Compare layer table export will download automatically once ready.
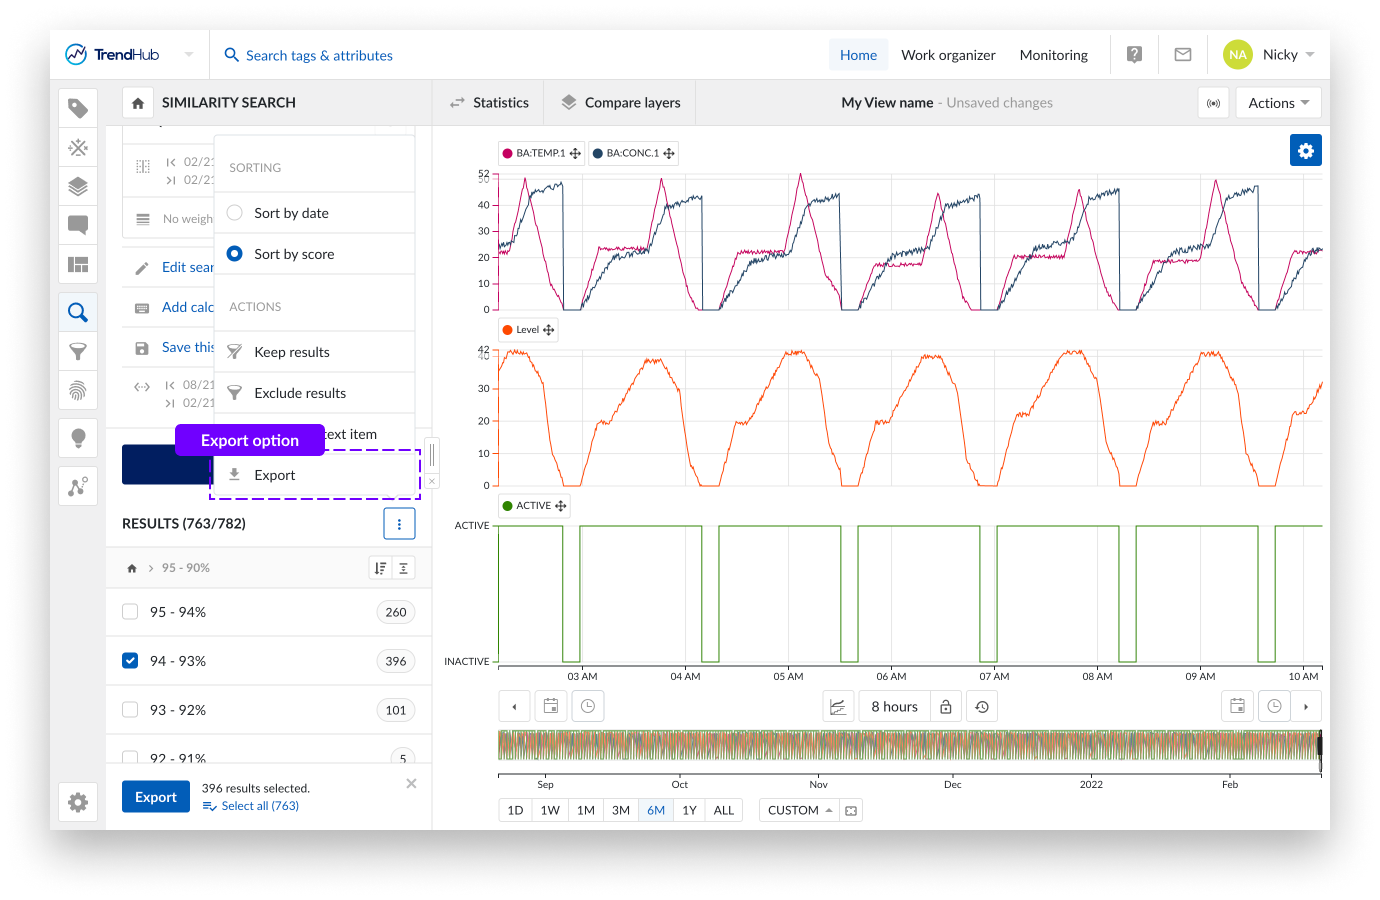
También puede exportar los resultados de la búsqueda a un archivo Excel. Lea este documento para obtener más información sobre cómo realizar búsquedas en TrendHub.
En cuanto se ejecuta una búsqueda, los resultados de la misma, con todos los cálculos disponibles, pueden exportarse. Para exportar los resultados de la búsqueda, basta con hacer clic en el botón de opciones de tres puntos de la cabecera de resultados, seguido de la opción "Exportar".
Ahora puede seleccionar los resultados que desea exportar y seleccionar la zona horaria deseada antes de que se inicie la exportación.
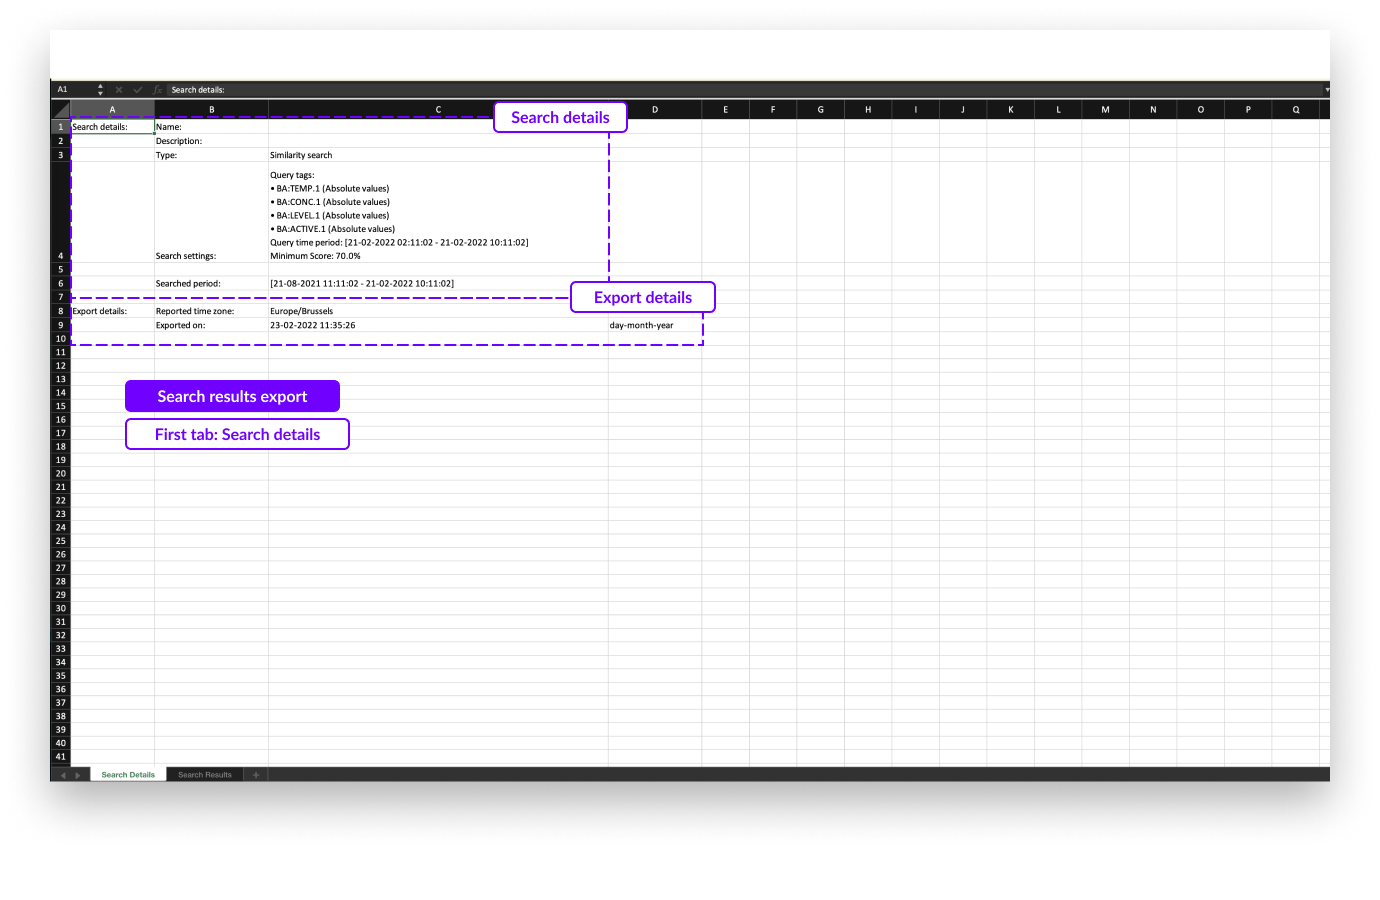
El archivo Excel exportado consta de 2 pestañas:
Una primera pestaña, resumida, que contiene los detalles de las condiciones de búsqueda
Una segunda pestaña que contiene los detalles de los resultados de la búsqueda
En la primera pestaña verá los siguientes detalles sobre la búsqueda:
Nombre de la búsqueda (si está disponible; esto sólo se aplica a las búsquedas guardadas)
Descripción de la búsqueda (si está disponible; esto sólo se aplica a las búsquedas guardadas)
Tipo de búsqueda
Ajustes de la búsqueda incluyendo
Tags consultados
Periodo de tiempo consultado (Búsqueda de similitudes)
Puntuación mínima (búsqueda de similitudes)
Pesos y periodo de pesos (búsqueda de similitudes)
Periodo de búsqueda (Periodo de contexto)
Detalles de la exportación como la zona horaria y la fecha de exportación
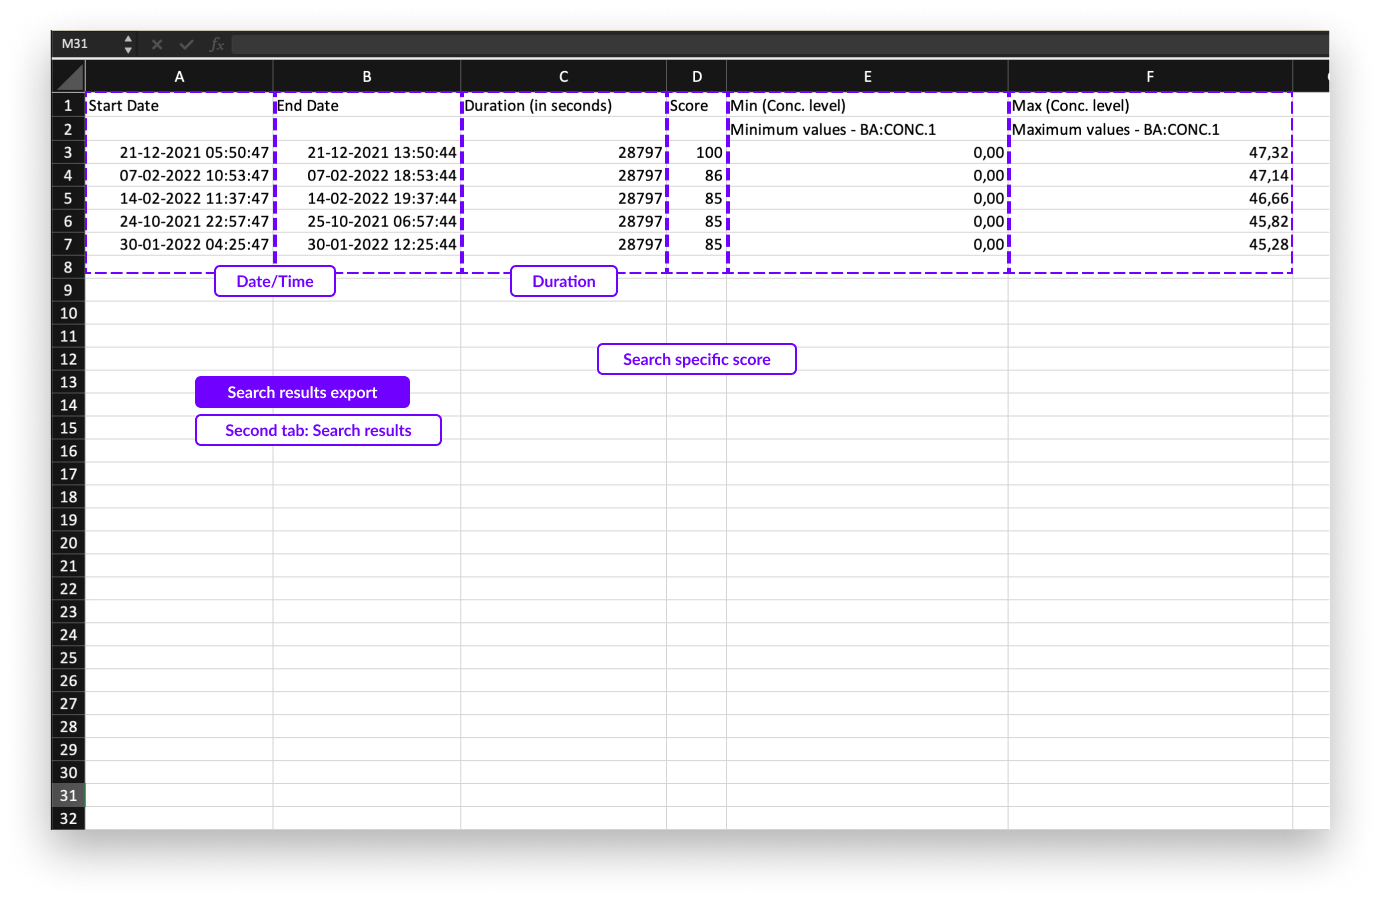
En la segunda pestaña del archivo de exportación, encontrará la siguiente información de los resultados de la búsqueda:
Fechas de inicio y fin en las dos primeras columnas
La duración del resultado de la búsqueda
Parámetro específico de la búsqueda (Por ejemplo, puntuación de los resultados de la búsqueda de similitudes)
1 columna adicional por cálculos disponibles
Nota
La exportación de búsquedas puede descargarse en el centro de notificaciones una vez creada. La descarga también permanece disponible durante 7 días antes de que "caduque".