TrendHub View Tile
Trend tiles display the graphic content normally seen in a TrendHub view. This includes, trend plots, stack plots and scatter plots. The view is inclusive of TrendHub display options, for example, grid lines, context items and trendline filling options.
Start a new or open an existing dashboard.
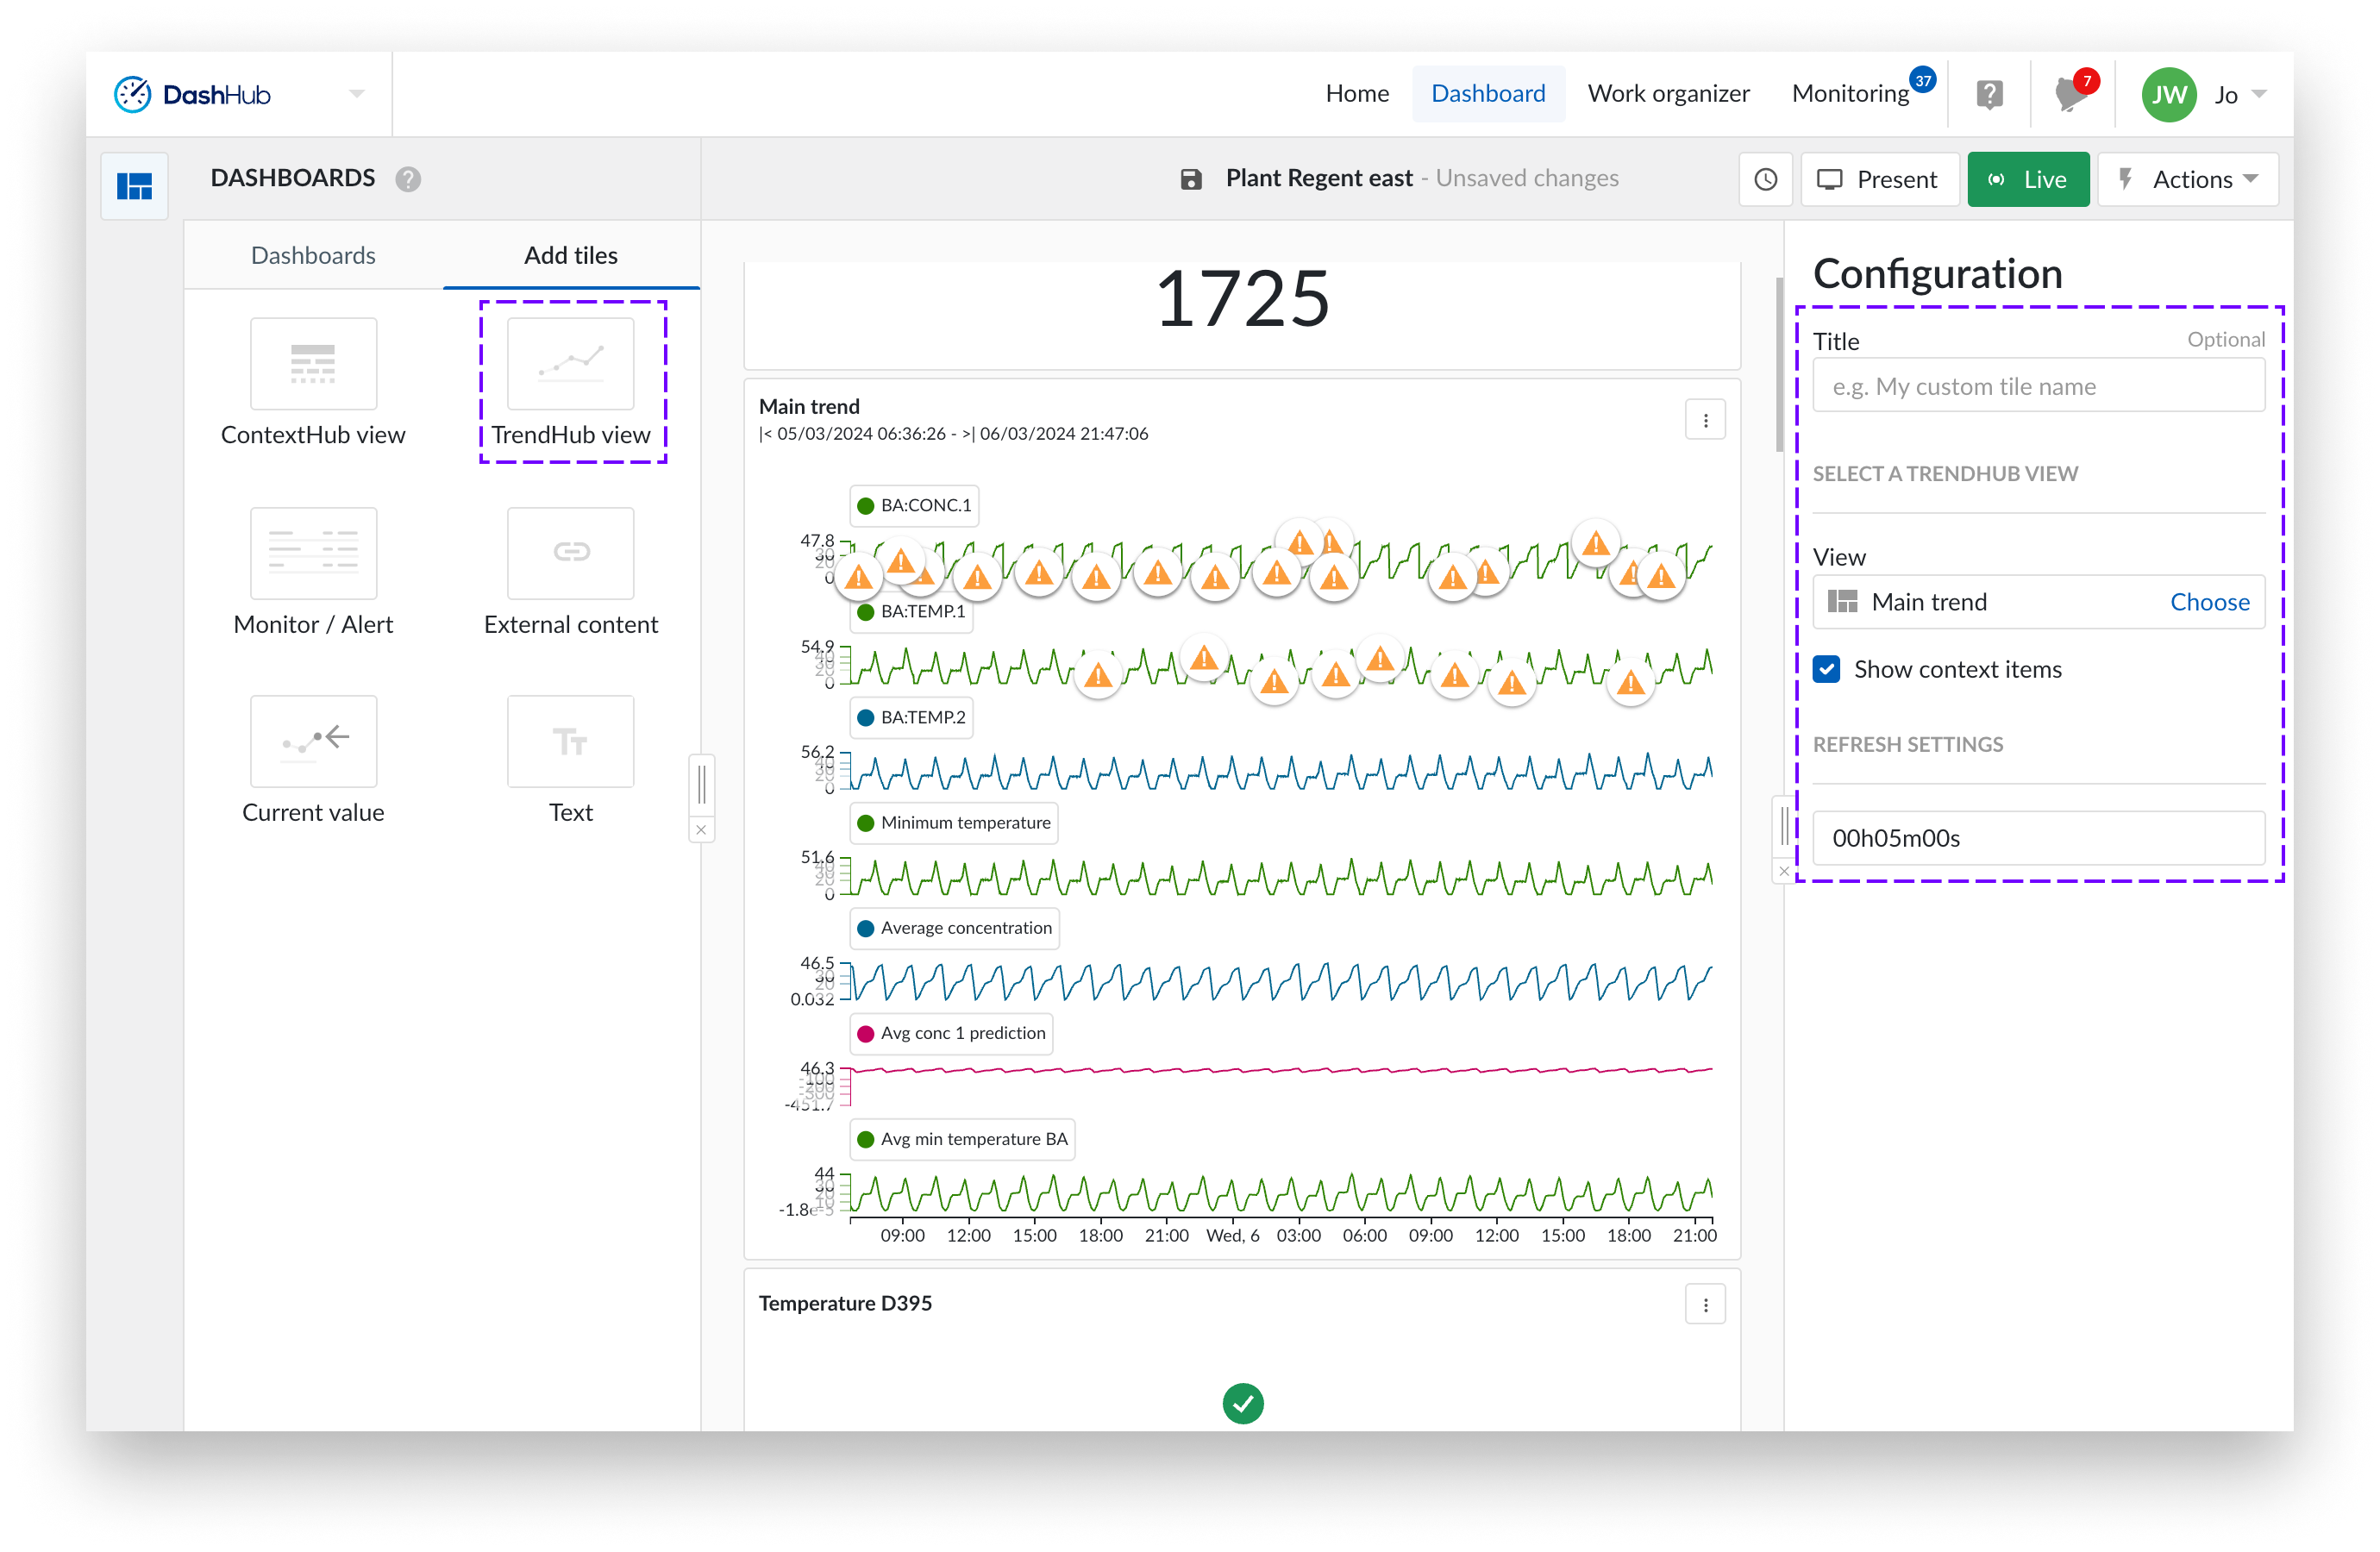
Select "Add tiles" to create a new tile. You can add the tile to the dashboard by either dragging the tile to the dashboard or double-clicking it. A side panel appears from the right side of the screen.
Add a title of your choice. By default, it takes the name from the view.
Click the "Select a view" to open the work organizer, and choose a view.
Select the trend view of your choice.
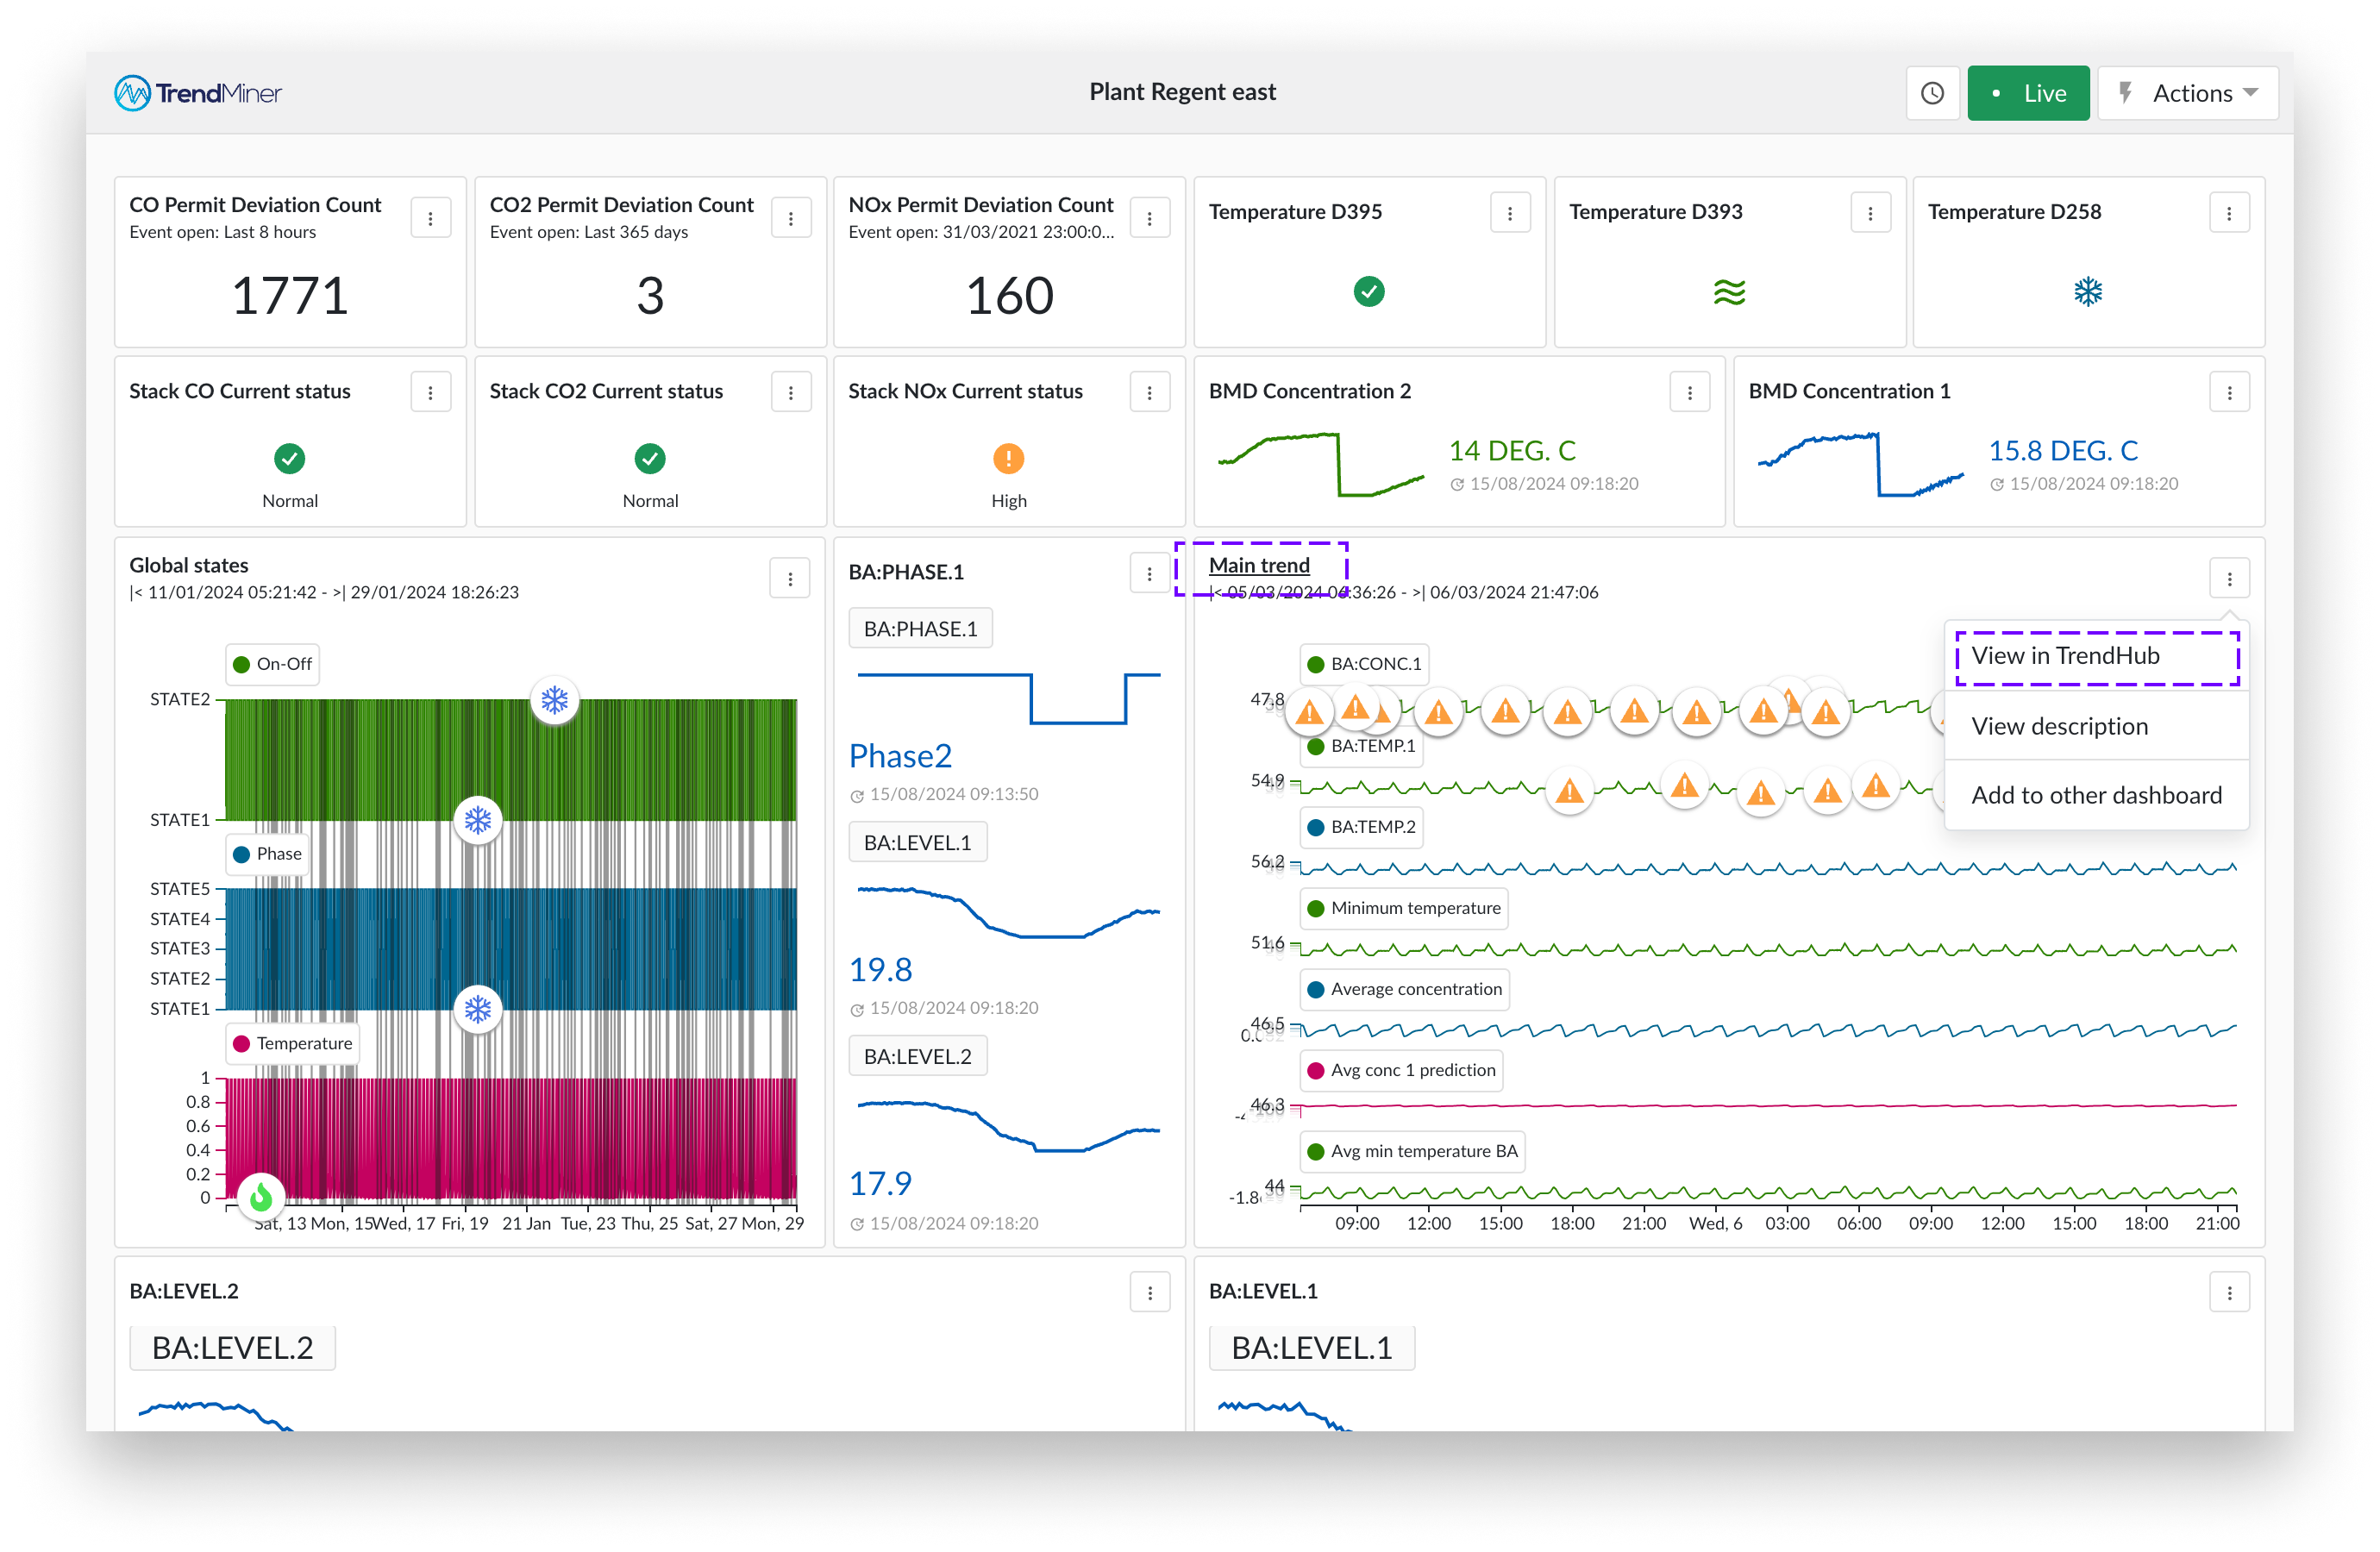
Check the “Show context items” checkbox if you would like to also visualize context items directly on the tile. If the “Show context items” checkbox has been selected, context items corresponding to the selected components will appear on the chart.
Click the three vertical dots icon in the top right corner of your trend tile and select "View in TrendHub," or simply click the title of the trend tile.