Tag Builder: Custom calculations
Note
This functionality is available from TrendMiner version 2024.R1.1 onward and requires an expert user license.
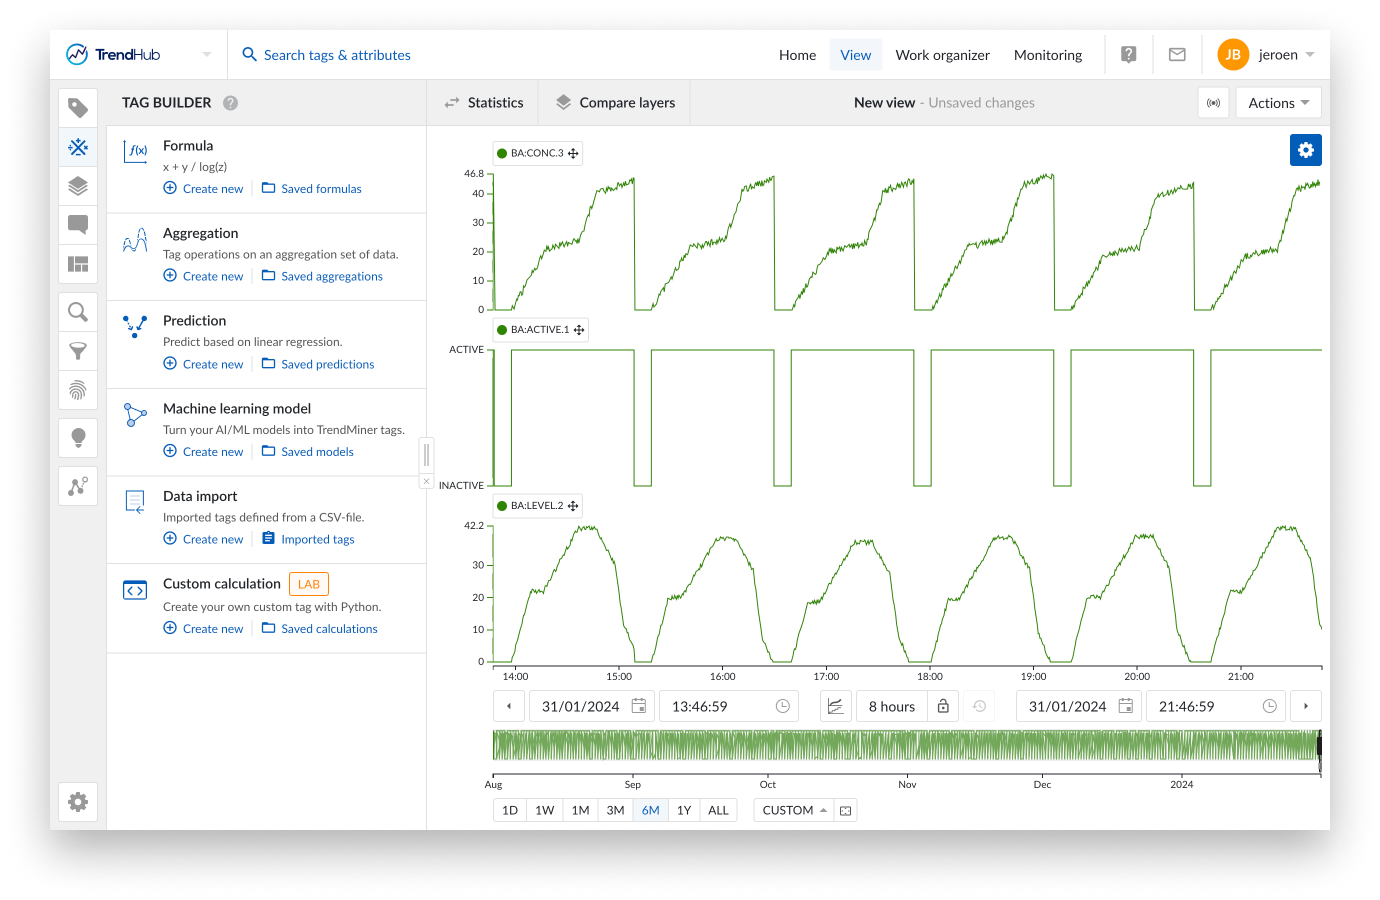
The custom calculation option in the tag builder enables you to create new TrendMiner tags based on a custom developed Python script. This allows you to go beyond the standard tag manipulation capabilities of TrendMiner and open up additional use cases. Once created, these tags can be displayed and analyzed as any other tag in TrendMiner. The custom calculations can be found in the tag builder menu. The custom calculation feature is marked as a LAB feature, which means the feature remains in active development and might change in newer releases.
Notice
This feature is only available if you have access management rights to the Custom Calculations
This first part of the article describes the flow of setting up a custom calculations tag and the requirements for the provided scripts. The article also describes which data will be used to plot the data and the limitations specific to custom calculations.
The general workflow of tag builder tags applies on custom calculations. An overview of these workflows can be found here. The configuration panels of custom calculation tags are set up differently to enable easy iteration cycles during the development of the script. This is achieved by providing a dedicated code editor and preview mode.
Script development panel
When entering the custom calculation menu, the focus chart is completely replaced by the script development panel, consisting of 2 tabs:
Code
Preview
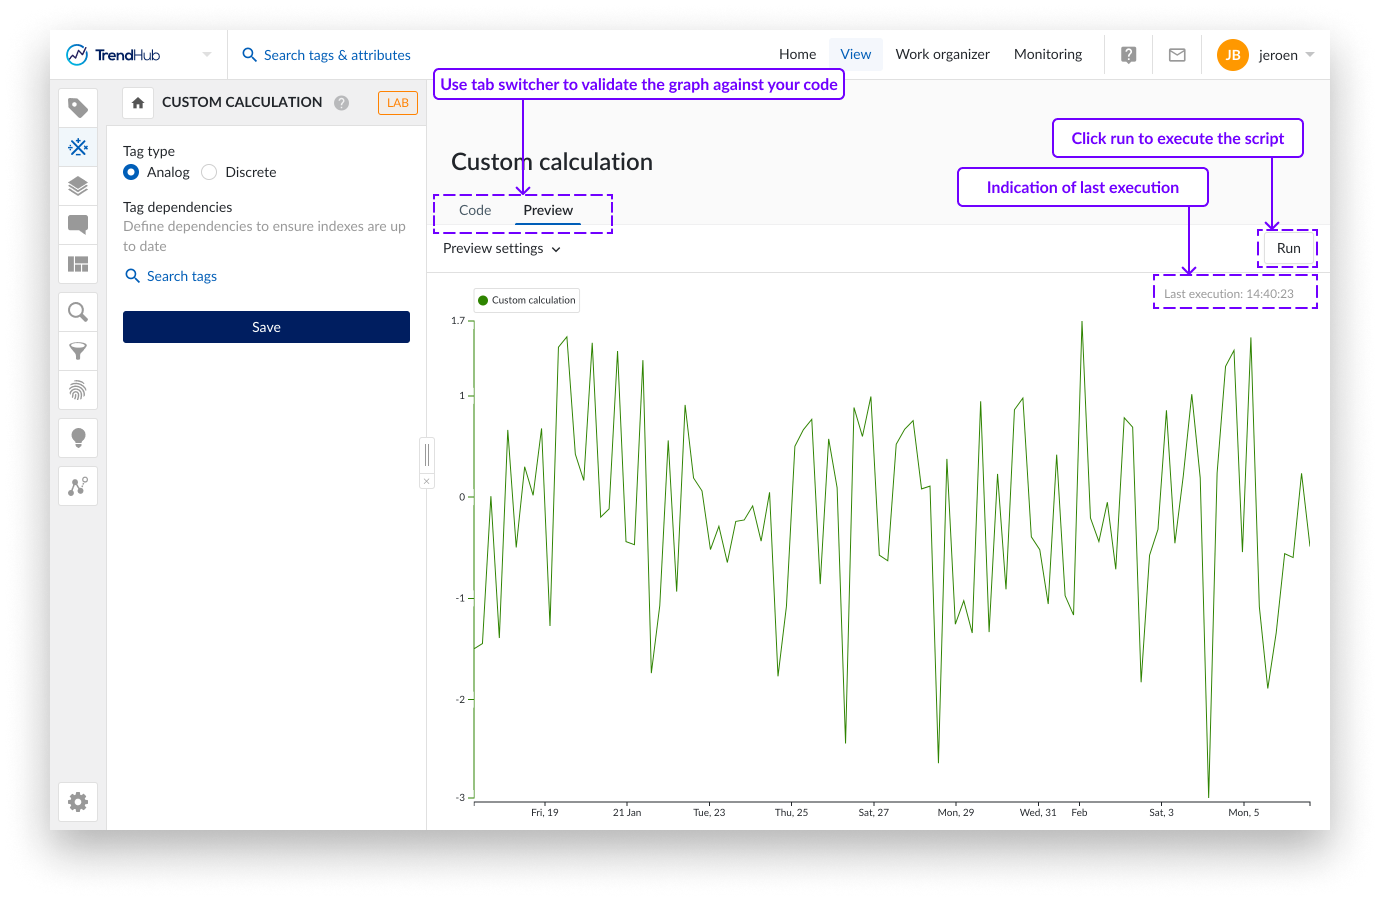
Your custom python script can be copied into or created from scratch in the editor on the code tab. Python syntax highlighting is enabled out of the box to increase the readability. Please refer to the next section to learn how a script should be set up to yield a usable TrendMiner tag. The run button on the right side can be used to execute the current script and will automatically open the preview tab. Although any script without graphical output can be executed, the main goal of this feature is to create a new tag, and so the set of time stamps and values should be provided . If they are provided, the preview tab will show a graph of the scripted behavior of the tag based on the applied start and end time in the preview settings.
You can switch between the code and the preview tab. The script will only be executed when clicking run. A timestamp is shown on the preview tab to indicate when the script was last executed.
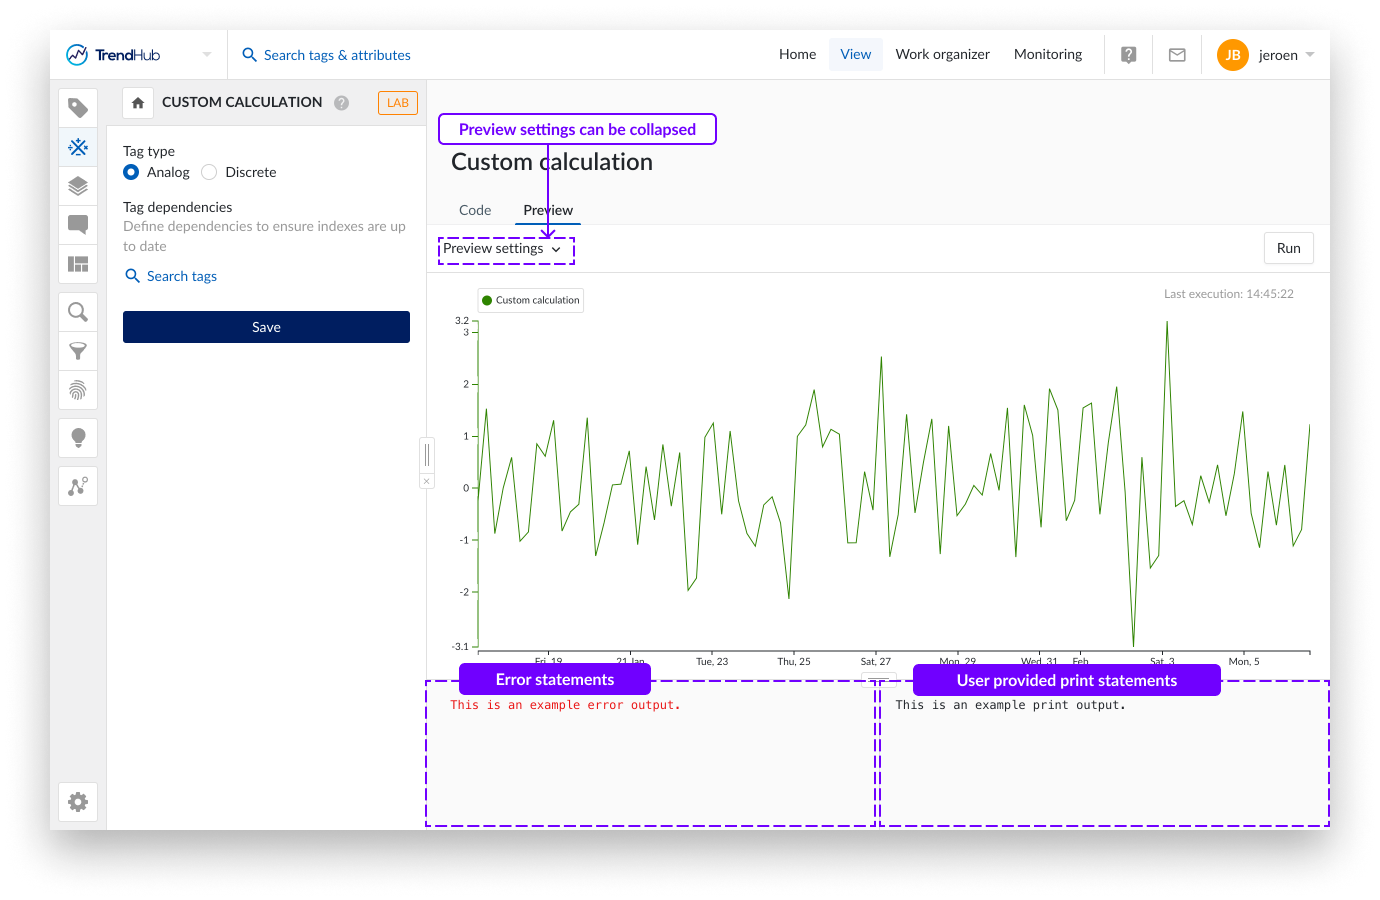
By default the preview settings span the last 8 hours. The start and end date can be modified to test a custom period of interest. The total time span of preview mode, however, is limited to 1 month.
Print statements can be added to the script to help during development. These print statements, as well as errors will be shown underneath the graph in case they are applicable. If no errors are present and no print statements are used, these text boxes will be omitted.
Notice
The preview settings and the indication of the last execution is provided in your local timezone. These timings are converted to UTC, which will be used in the script and shown in the print statements.
Tag configuration
Although the main behavior of the custom calculation will be influenced by the script itself, there are 2 configurations that need to be specified in the left menu.
Tag type
The tag type determines how provided data of the tag will be interpolated. Data will be interpolated linearly (Analog tag), or stepped (Discrete tag). Being able to save the tag as a String or Digital tag is currently not supported.
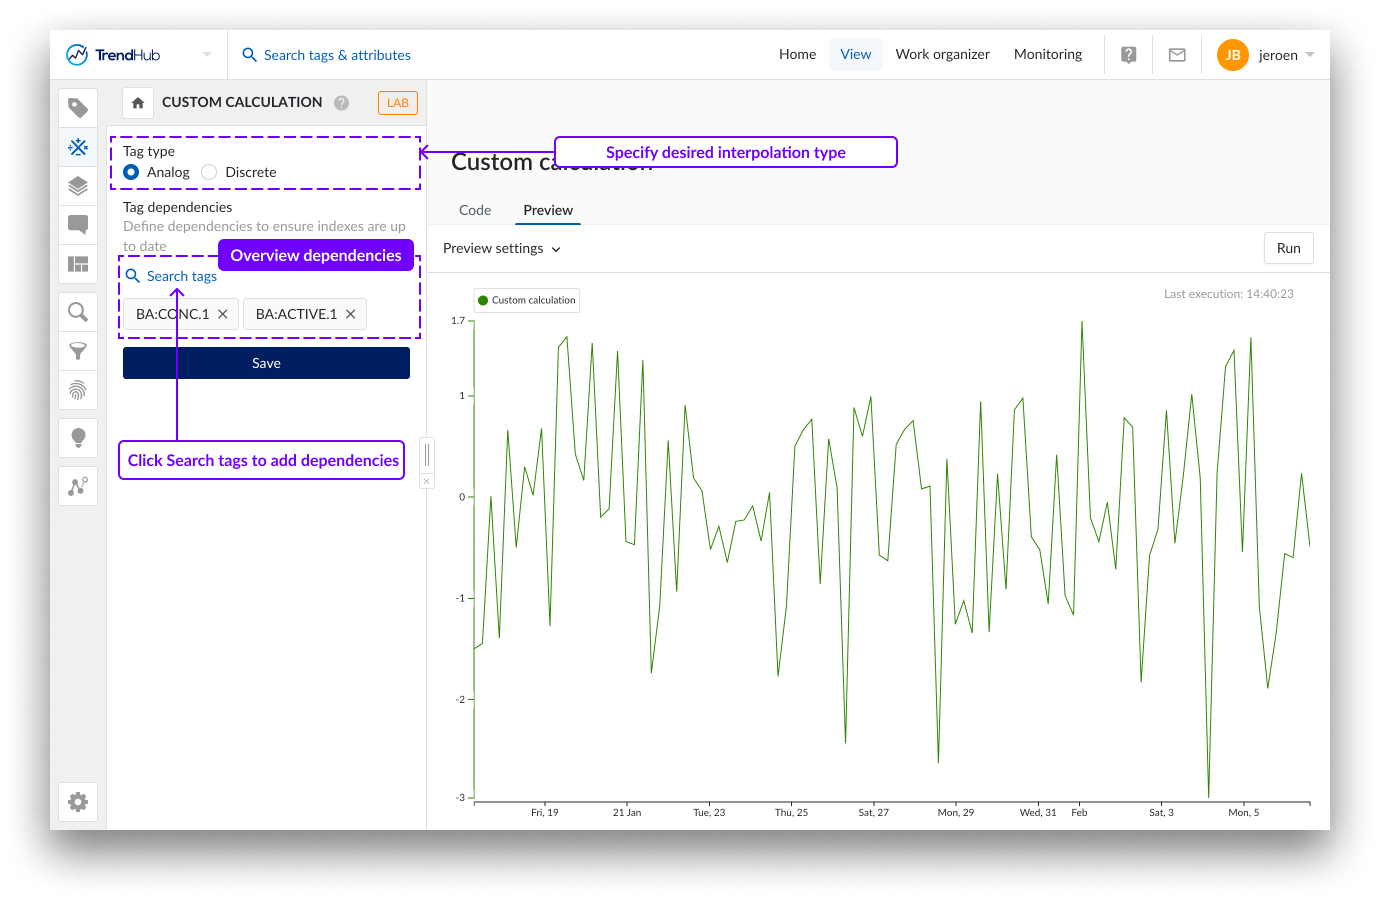
Tag dependencies
In the tag dependencies section, you should select all tags that are being accessed in your script. This is different compared to all other tag builder types, where dependencies on mapped variables are automatically detected as part of the creation flow of a tag. With custom calculations, TrendMiner can not deduce which tags are being used. This information is crucial in case a custom calculation is used within a monitor. In that case, TrendMiner needs to make sure the index of the custom calculation as well as all the dependencies are up to date. The maximum number of dependencies for custom calculation is set to 50.
Warning
In case tag dependencies are not provided, monitor results will be delayed, or potentially not triggered if the indexes of the used tags do not exist.
Requirements
The Python script needs to adhere to a couple of requirements to make sure the preview (and the indexation) of a custom calculation will work correctly.
Minimum viable script
When creating a new custom calculation, a placeholder script will be provided in the editor. This is a dummy example, containing all the necessary elements to correctly create and save a custom calculations tag. Feel free to experiment with this script to understand how the time series creation works.
import numpy as np
import pandas as pd
import os

# Parameter configuration
output_file = os.environ["OUTPUT_FILE"] # Where to write output table
start = os.environ["START_TIMESTAMP"]   # Start datetime of range to compute values in
end = os.environ["END_TIMESTAMP"]       # End datetime of range to compute values in

# Code to compute table
num_points = 100
pd.DataFrame(
    {
        "ts": pd.date_range(start, end, num_points),
        "value": np.random.randn(num_points)
    }
).to_csv(output_file, index=False)
Based on this dummy example, the following elements are mandatory:
Accessing the output file.
Accessing the start time of the period for which the calculation (in preview as well as during indexing) will be done.
Accessing the end time of the period for which the calculation (in preview as well as during indexing) will be done.
Storing time series data to the output file, which is stored as a CSV file:
the file should contain 2 columns
time stamps
values
Next to these elements, the generated output also needs to comply to the following requirements. If this is not the case, both the preview as well as the indexation of the tag will fail.
The output data needs to fall within the specified time ranges (provided start and end time)
Duplicate points, i.e. same time stamp , are not allowed.
A maximum of 6 data points per index interval is allowed.
The script should be able to complete within 2 minutes for a 1 month period.
Each scripts has 512MB of RAM available. The script should be able to complete within this boundary.
Notice
Before saving the tag, it is advised to test the preview on 1 month of data, since backwards indexing will be executed per month. This provides a level of certainty that indexing will work correctly.
Clear error messages appear when running the script if the requirements are not met.
Extending the minimum viable script
To accomplish your use case, you can extend the minimum viable script based on your needs. A default set of Python packages are available. Additional packages can not be installed.
Available packages
numpy
pandas
polars
pyarrow
python-dateutil
pytz
requests
scipy
In addition, TrendMiner SDK is available, which allows you to easily pull in TrendMiner data, like index data of tags.
To get an up-to-date overview of the available packages and their version, you can include the following code snippet in your script:
import importlib.metadata

installed_packages = importlib.metadata.distributions()
for package in installed_packages:
    print(package.metadata["Name"], package.version)
Notice
Feel free to reach out to your TrendMiner Customer Success Manager or Data Analytics Engineer to help you create more advanced calculations, or, refer to the TrendMiner GitHub to access sample codes for various use cases.
Indexing of custom calculations tags
In order to correctly set up a custom calculation script, it is important to understand how these tags will be indexed. To learn more about indexing itself, please refer to this article.
As soon as the custom calculation tag is saved, the tag will start indexing. Initially, the indexing process will do a historical backfill (i.e. backwards indexing). This is done by running the script per month. The START_TIMESTAMP and END_TIMESTAMP parameters in your script will always be the start and end time of a month during this process. Indexed tags will automatically be kept up to date (i.e. forward indexing). By default, a check for new data is done every hour. In case your tag is being used in a monitor, this will be done every 2 minutes. The START_TIMESTAMP and END_TIMESTAMP in this case, will be the time stamp of the last stored index point and the now moment, respectively. Although TrendMiner will check for new data every hour (or 2 minutes), the actual period on which the scripts get executed can be longer, depending on where the last data point was stored.
Preview mode
The preview mode will display all data points as returned by the scripts, taking into account restrictions mentioned above. As soon as more than 10.000 data points are returned, however, the number of data points will be down sampled.
Focus chart
Notice
The preview mode plot and the focus chart plot based on the saved custom calculation can look slightly different when visualizing 1 month of data, since a different sampling algorithm is applied.
Also for small windows, the focus chart will be rendered based on stored indexed data (maximum 6 data points per index interval).
Notice
Also for small windows, the focus chart will be rendered based on stored indexed data (maximum 6 data points per index interval).
The general limitations as mentioned in the Tag Builder overview document are applicable to custom calculations. Limitations specific to custom calculations include:
The number of saved custom calculations is limited to 120 per TrendMiner instance.
During indexing, all scripts will run in sequence. If multiple custom calculation tags are used in a monitor, and the scripts have a long execution time, an additional delay in monitoring results is expected.