Current value tile
The "Current value" tile displays the most recent value of a selected component.
Start a new or open an existing dashboard.
Select "Add tiles" to create a new tile. You can add it to the dashboard by either dragging the tile or double-clicking it.
The current value tile has a couple of settable options.
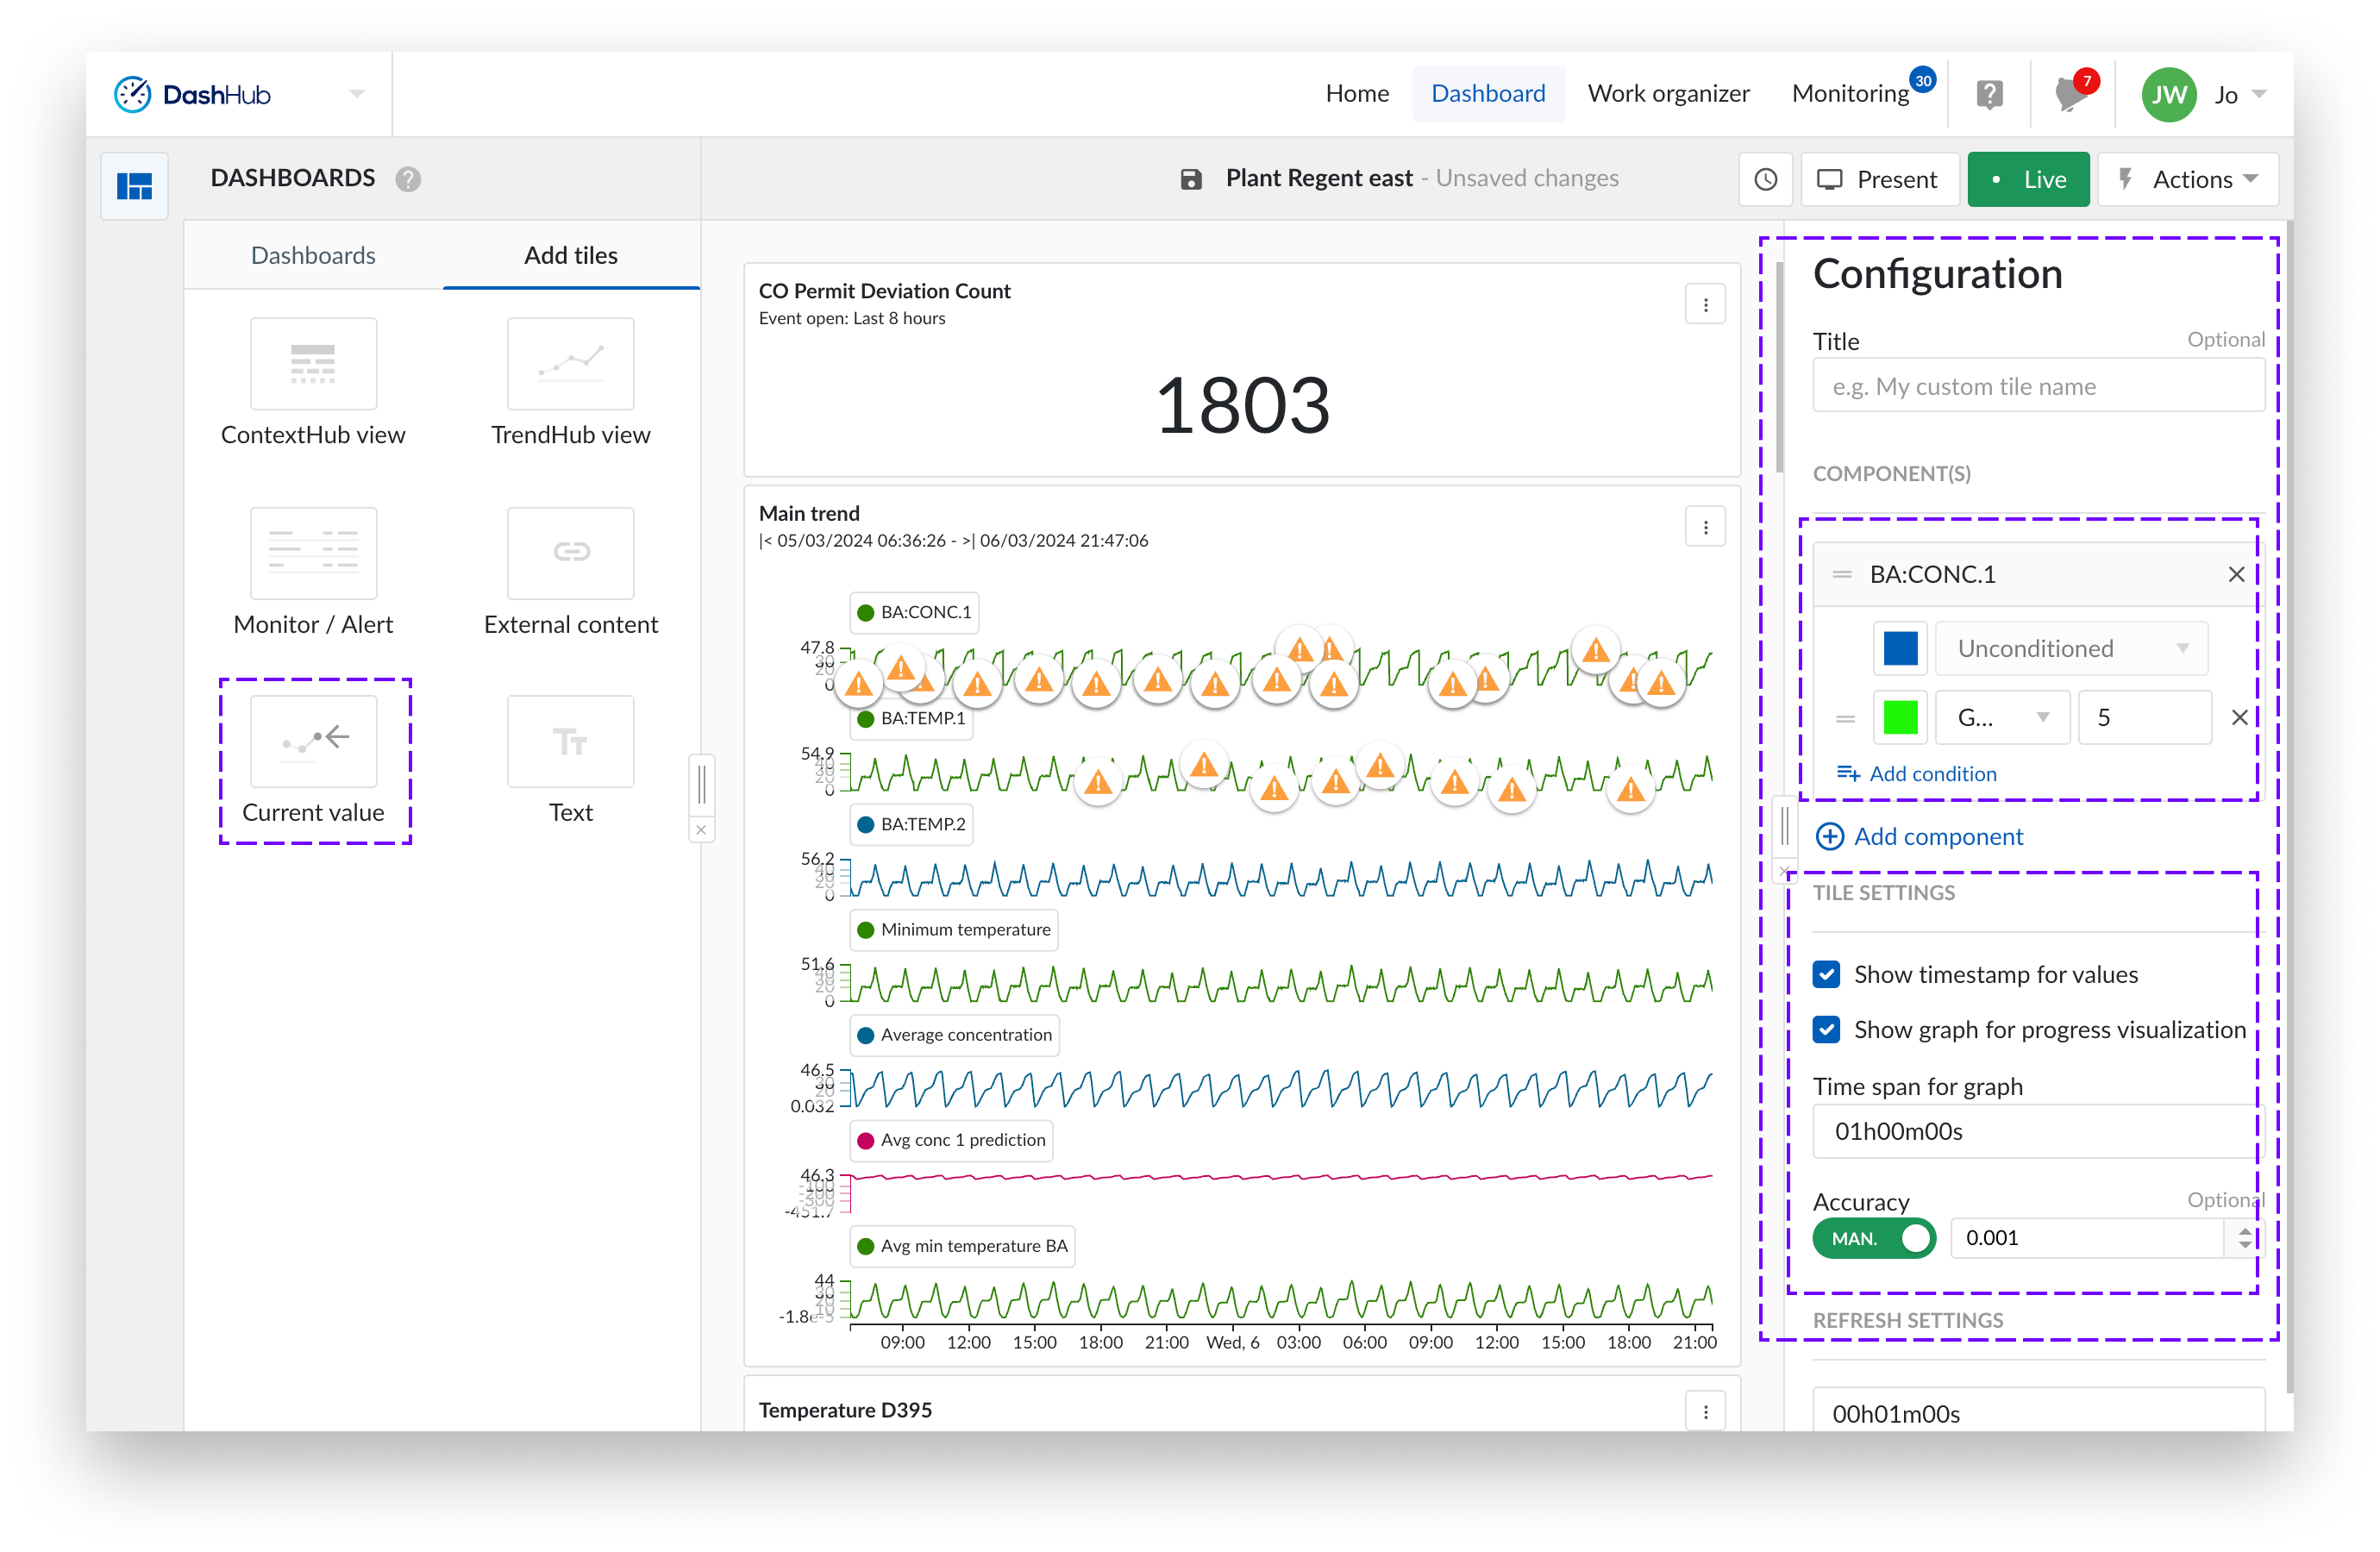
Adding components (required).
Select one or more components by clicking on the “Add component” button.
Each component has an unconditioned state but can have multiple conditions added by clicking the “Add condition” button.
Note
Any result that exceeds the value of the set condition will be highlighted in the color of the first condition. For instance, in the example above, if a result exceeds 12 (Nes Classic component), such as a value of 23, it will be displayed in orange.
The options for analog and discrete tags conditions include:
Greater than
Greater than or equal to
Less than
Less than or equal to
Equal to
Not equal to
Between
Not between
The options for digital and string tag conditions include:
Equal to
Not equal to
Contains
Does not contain
Tile settings (default values entered).
Click the check boxes if you wish your current value tile to include a timestamp for values and a graph for progress visualization (by default enabled).
You can also increase the time span of interest (up to 8 hours) and the number of digits after the decimal point you wish to see displayed by your current value.
Note
The refresh settings are by default 1 minute, but this can be changed.
Note
You can either specify the accuracy by entering the 10^-N, where N is the number of desired decimal points, or you could leave it to auto.
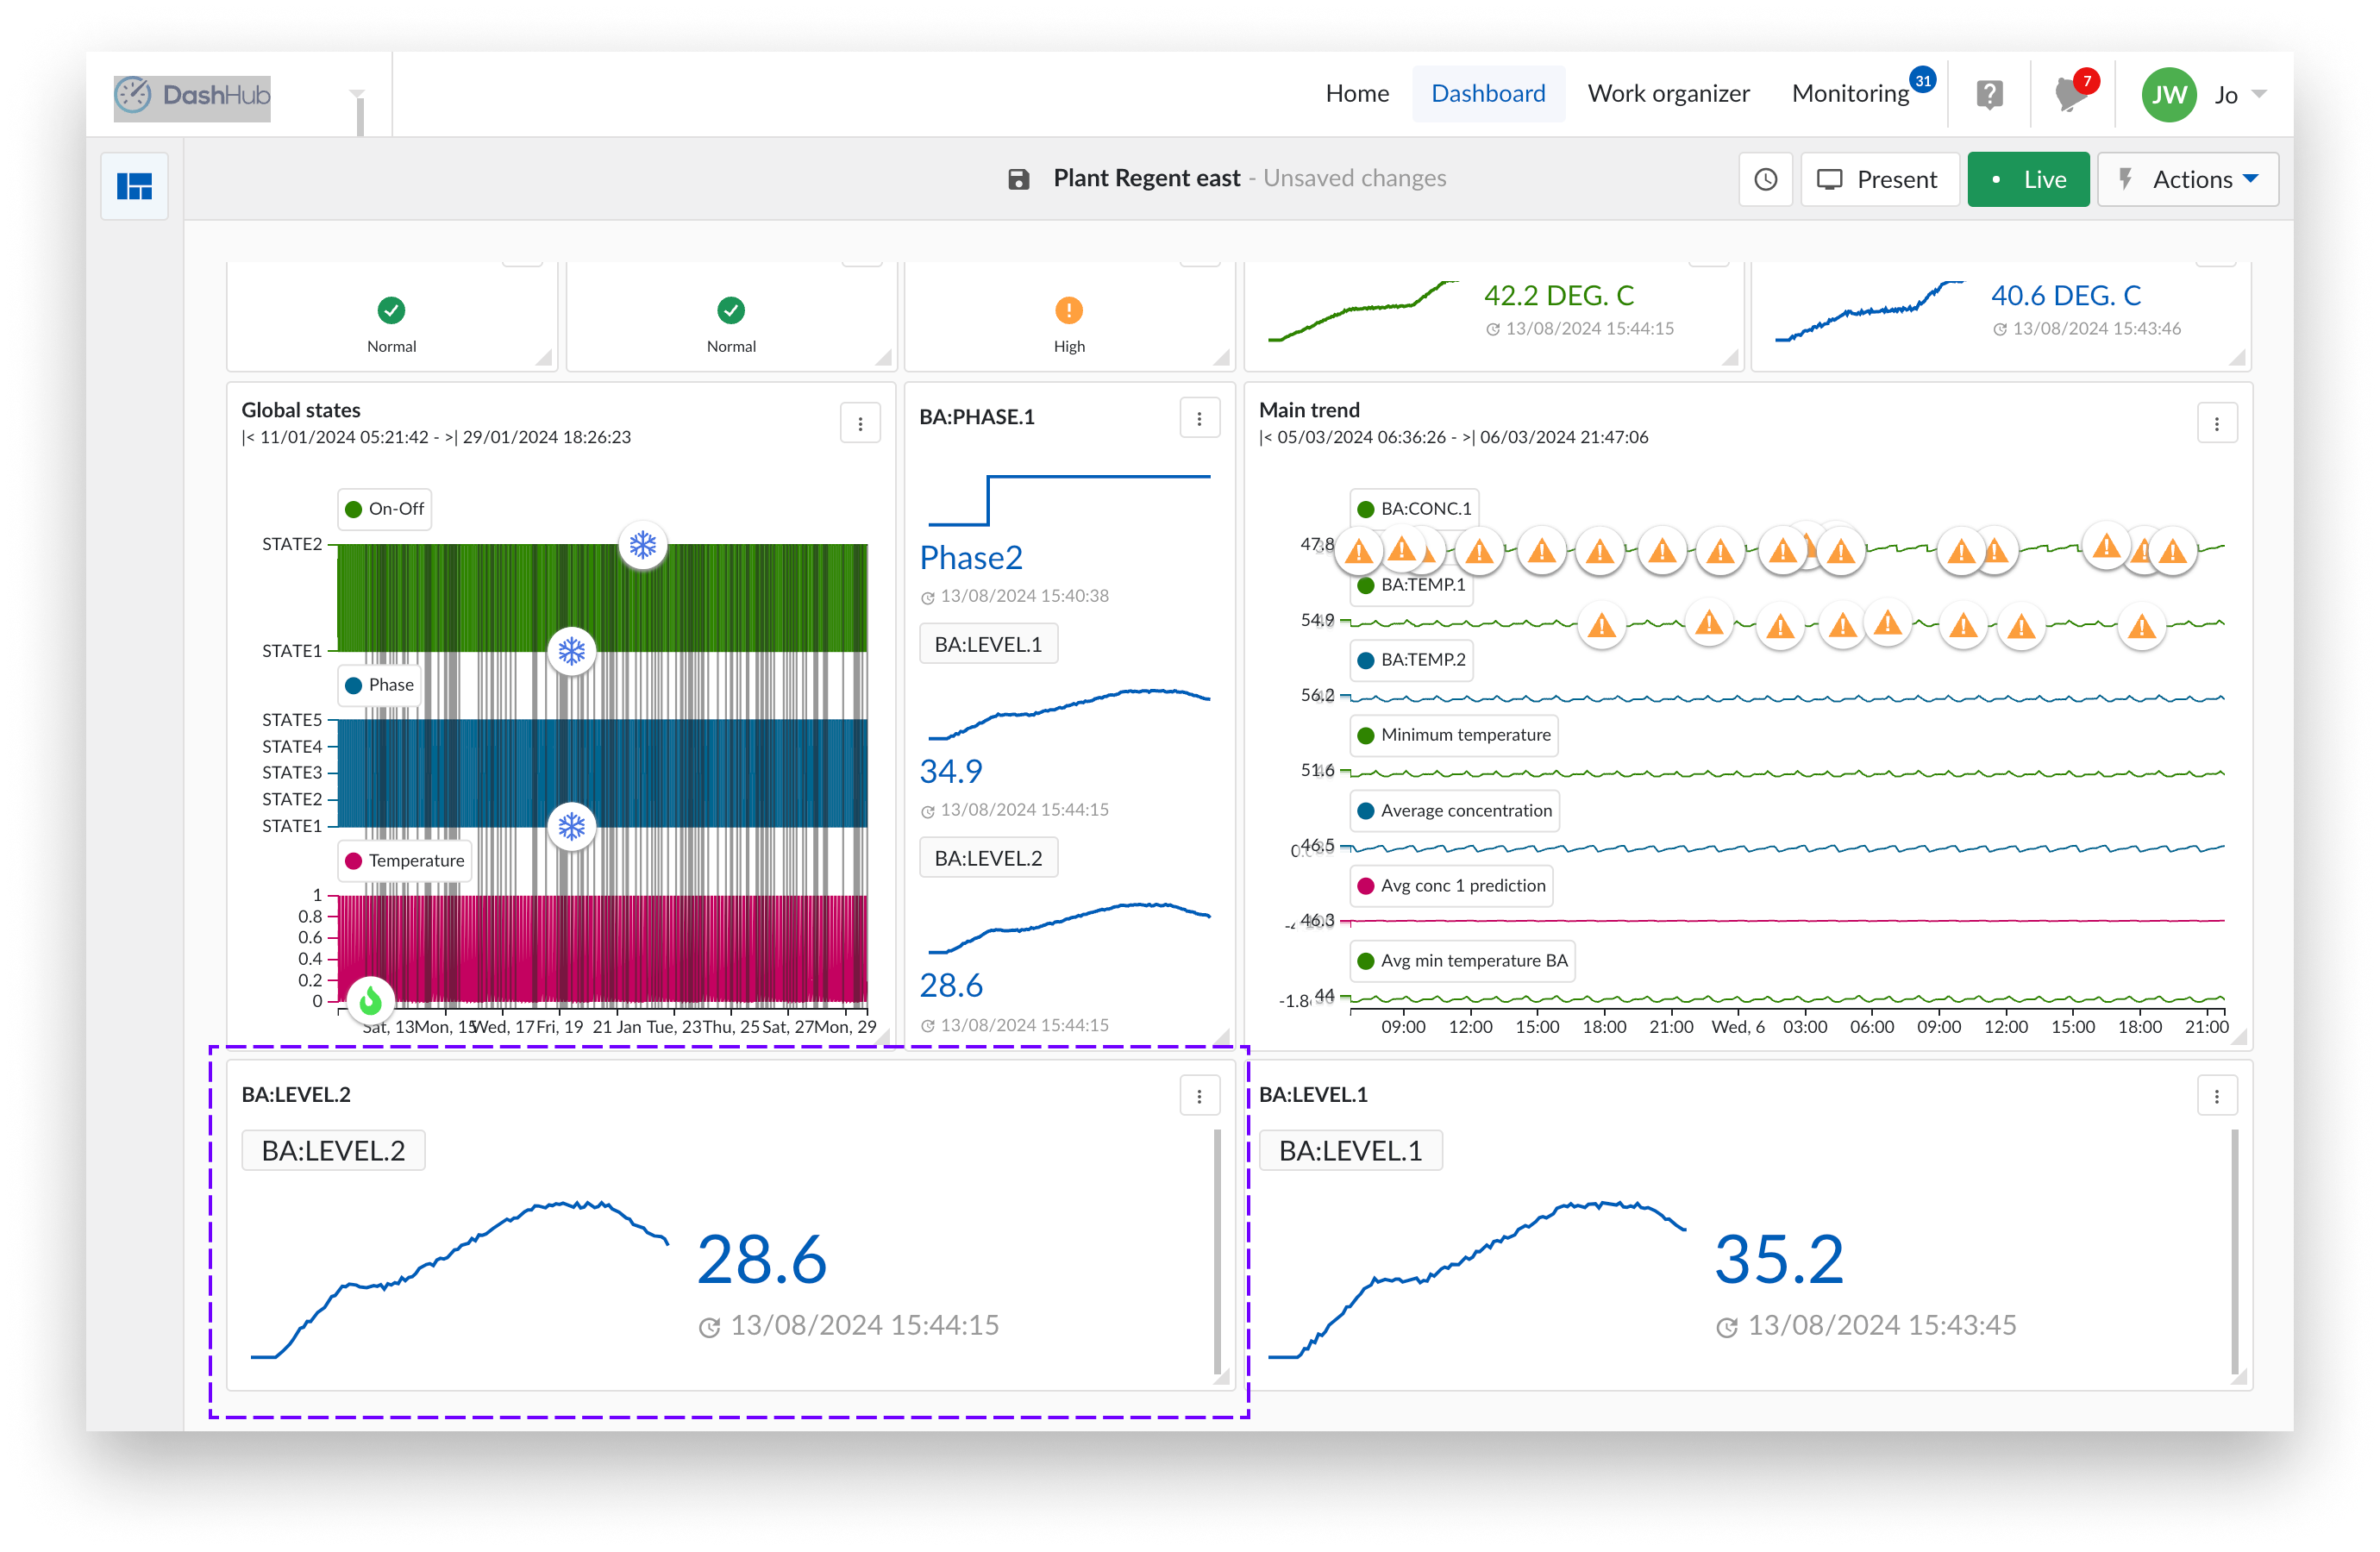
The following image displays a current value tile for one component. In addition, the latest time timestamps are displayed as associated graphs (timespan 1hr).