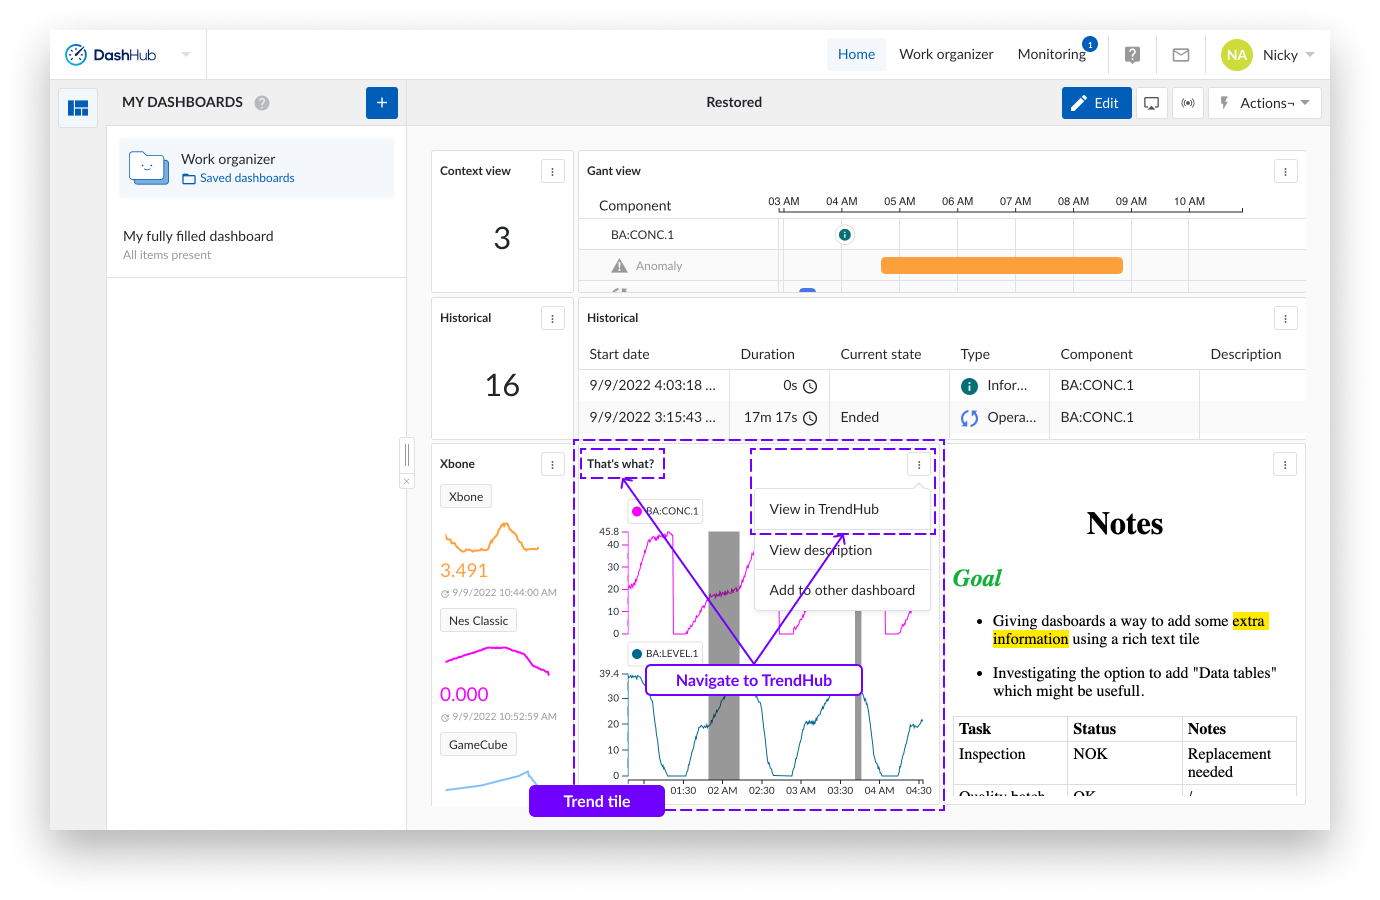
TrendHub view tile
Trend tiles display the graphic content normally seen in a TrendHub view. This includes, trend plots, stack plots and scatter plots. The view is inclusive of TrendHub display options, for example, grid lines, context items and trendline filling options.
Having opened a new or current dashboard in DashHub.
As with the context tile, start with a new or saved dashboard and click the "Action" button in the dashboard bar.
Click the "Create new tile" panel is shown on the righthand side of the screen.
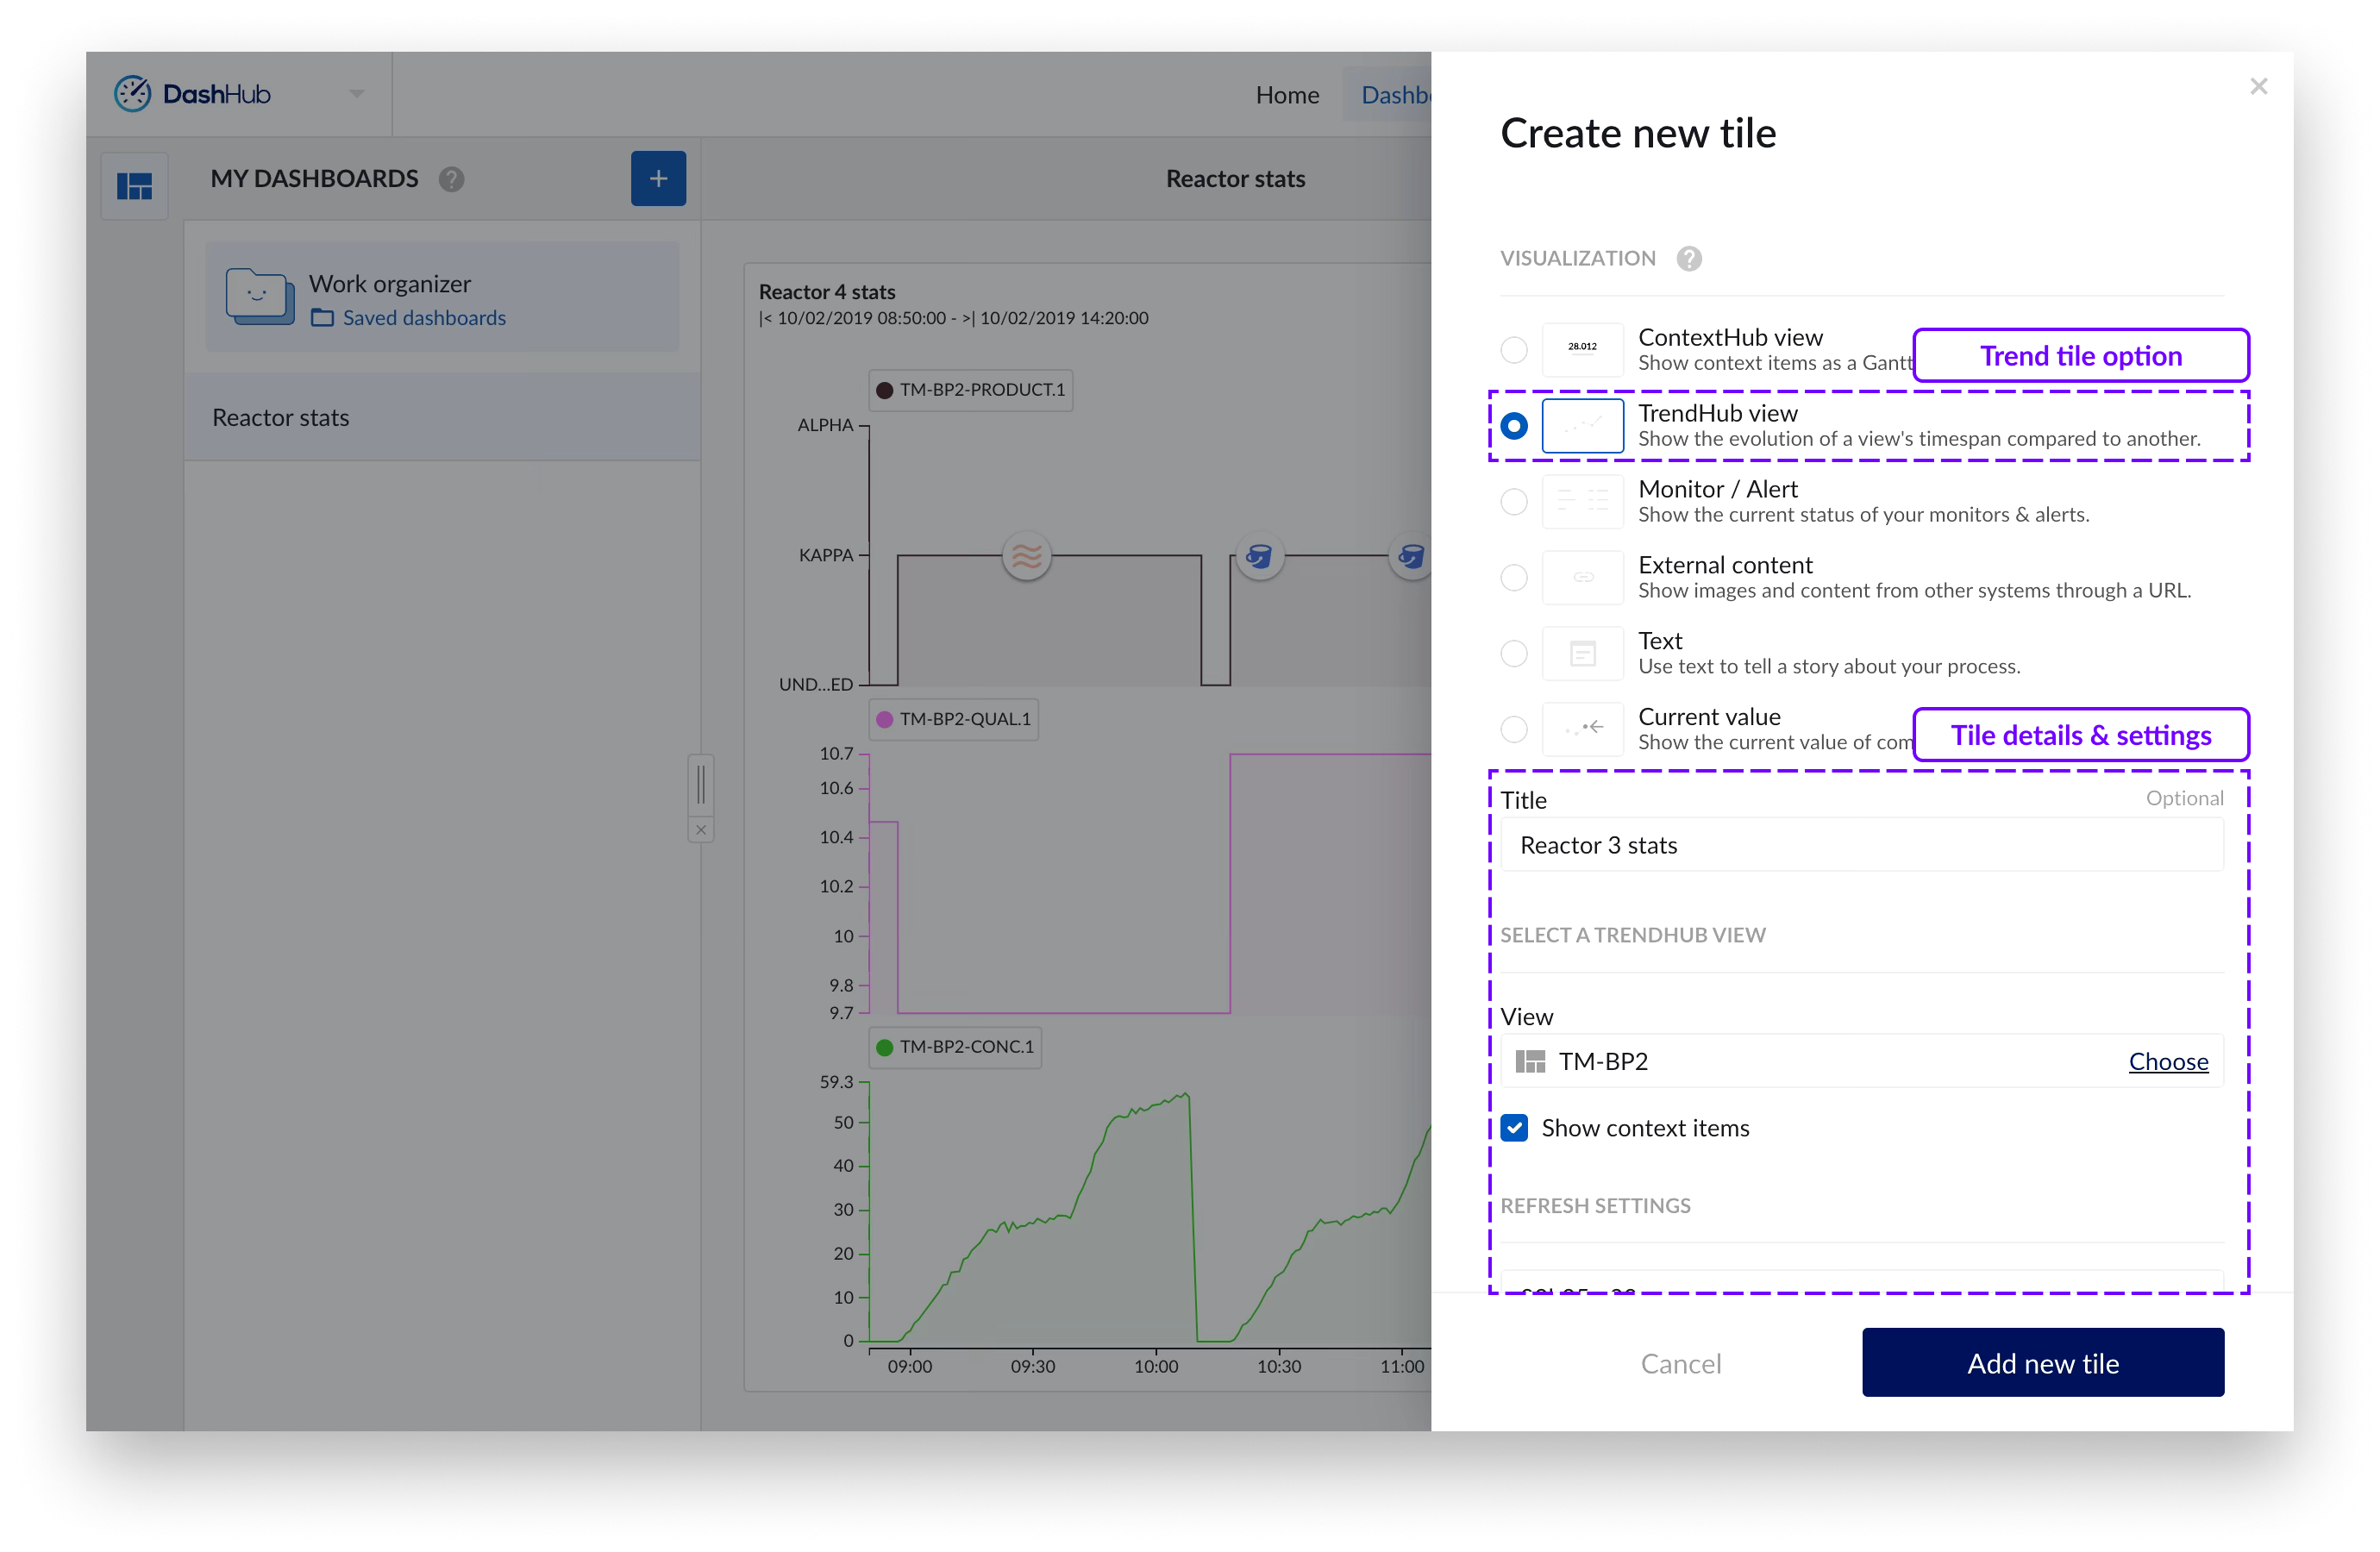
Select “TrendHub view”.
Fill in a title (optional) and click the “Choose” action to open the work organizer side panel.
Choose the desired trend view and confirm.
* Check the “Show context items” checkbox if you would like to also visualize context items directly on the tile.
To add the tile to the dashboard, click the “Add new tile” button at the bottom of the side panel.
* If the “Show context items” checkbox has been selected, context items corresponding to the selected components will appear on the chart as shown below.
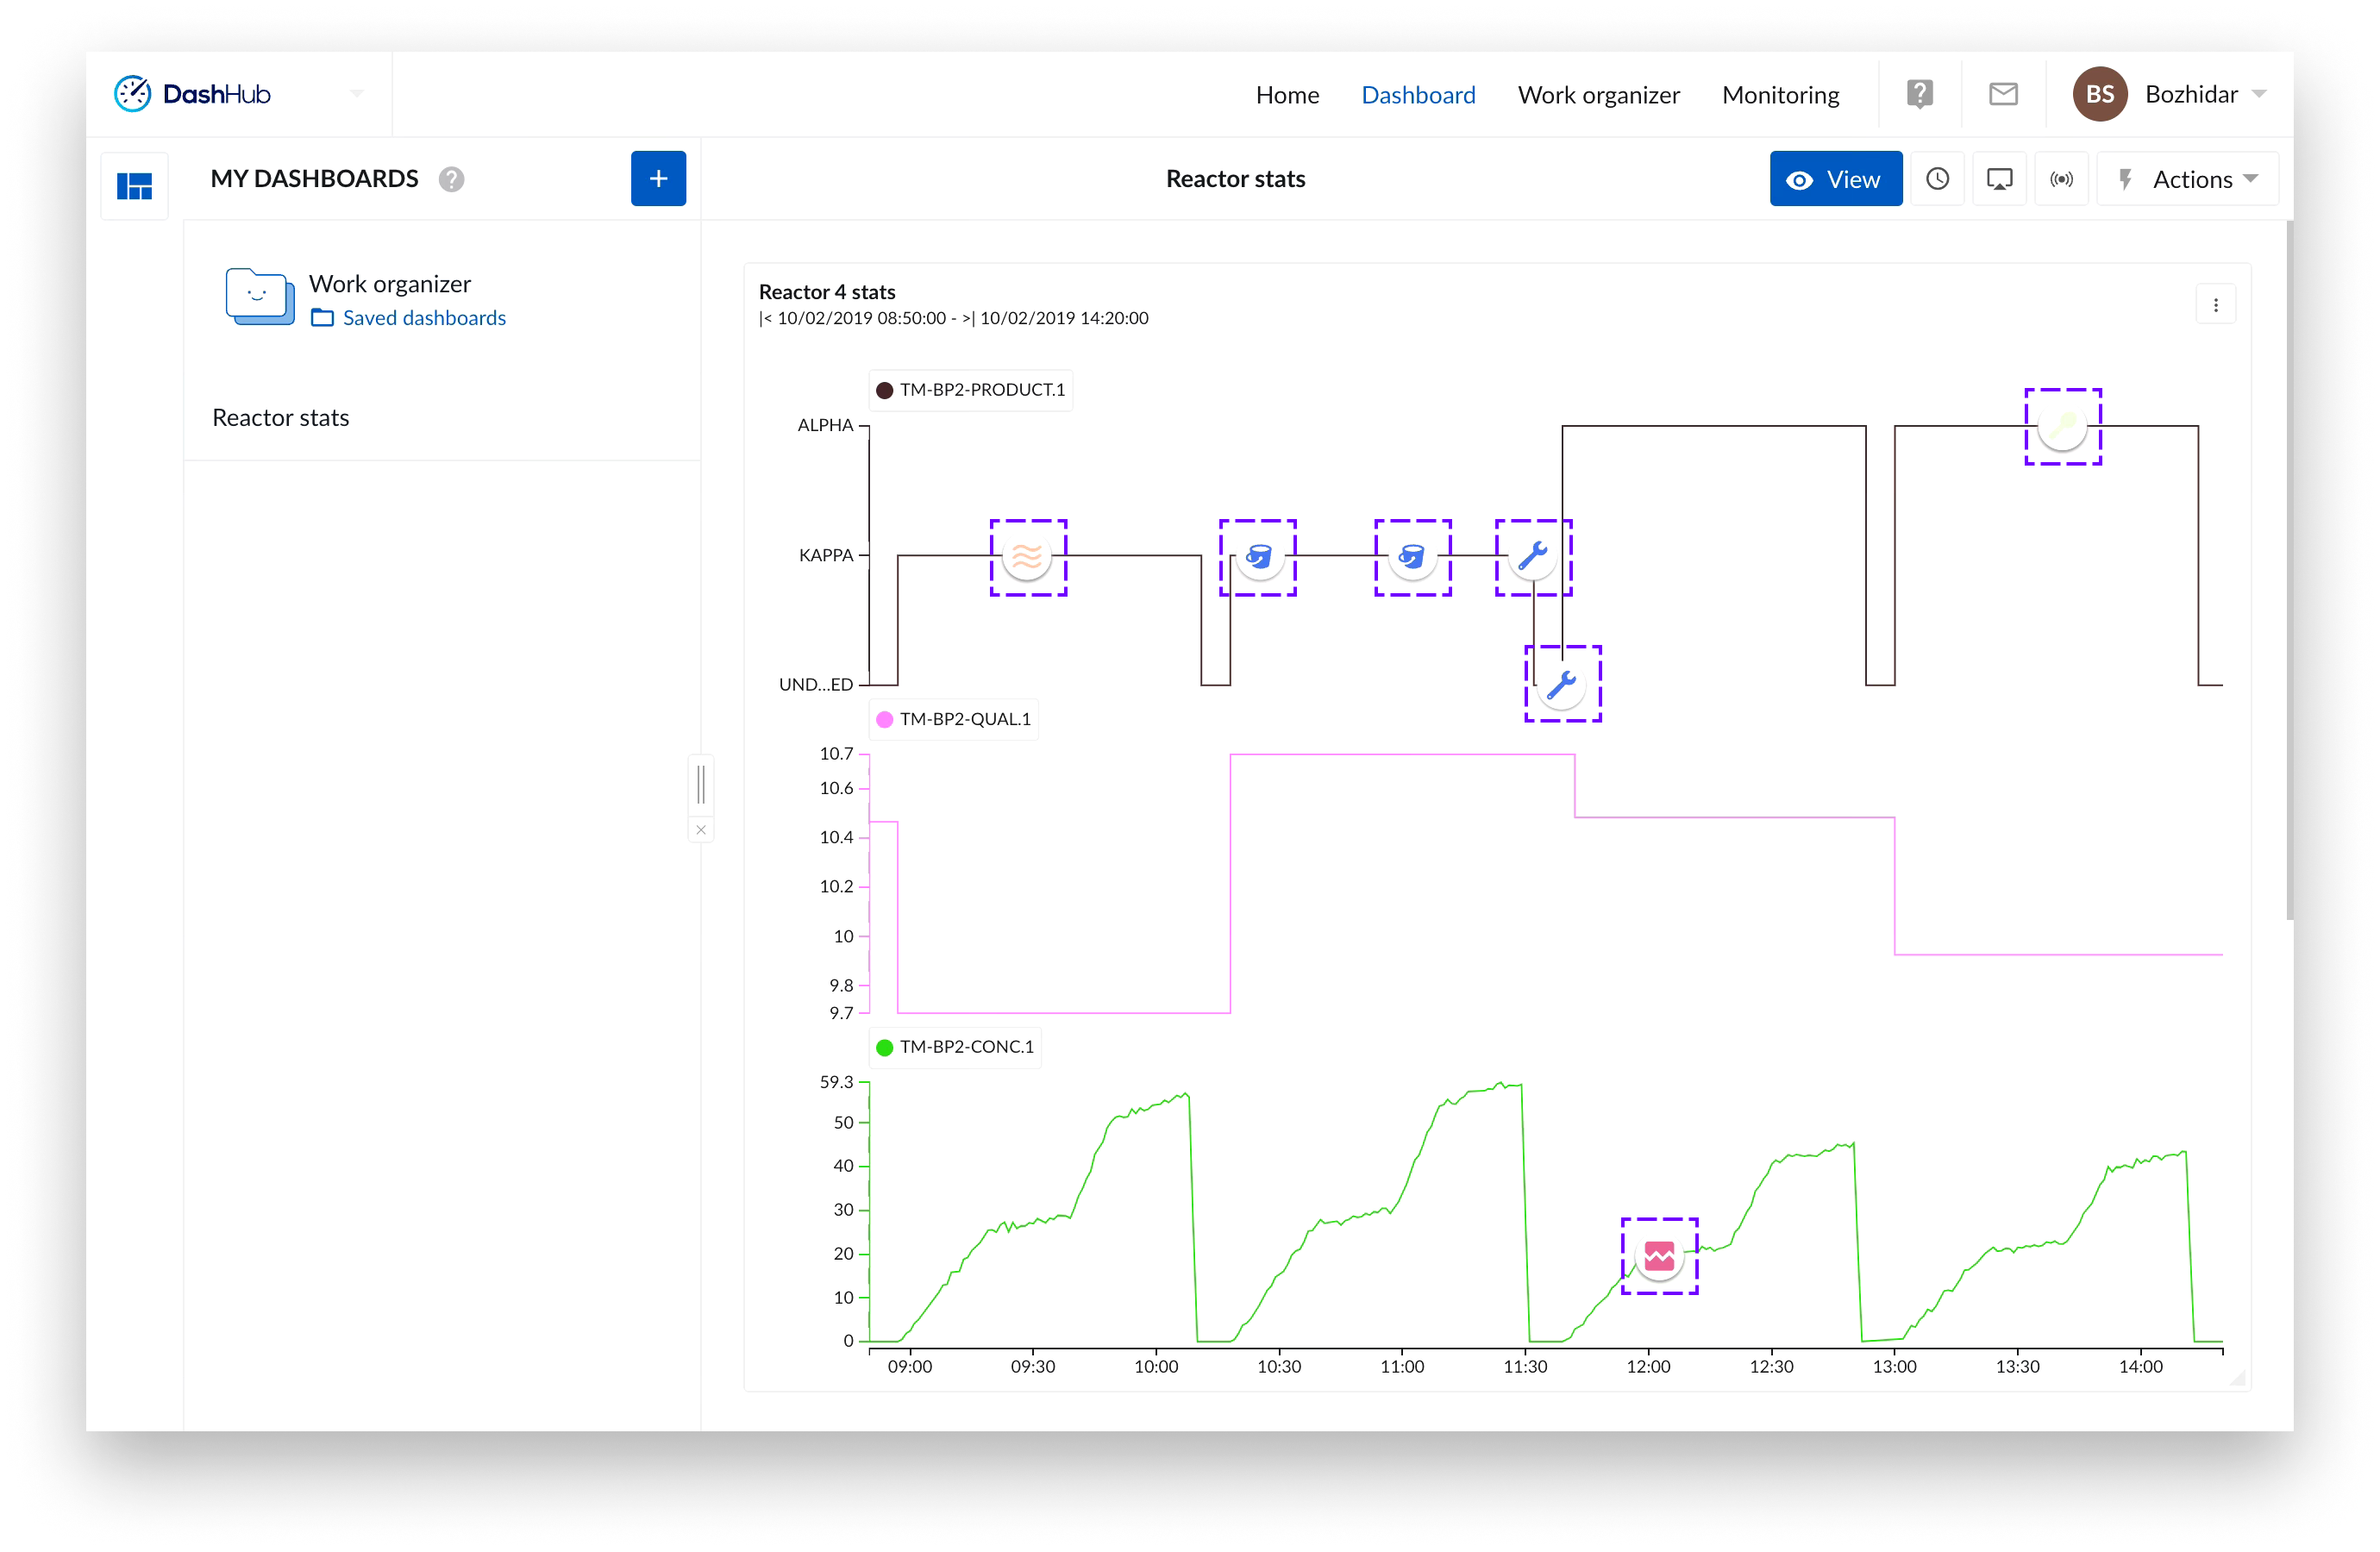
Click the blue “View” button on the right side of the dashboard bar.
Click the three vertical dots icon situated top right of your trend tile and select the option "View in TrendHub". Or,
Click the title of the trend tile.